Vechain (VETUSD) Elliott Wave Technical Analysis Daily Chart Analysis – TradingLounge
VETUSD Elliott Wave Technical
Function: Follow Trend
Mode: Motive
Structure: Impulse
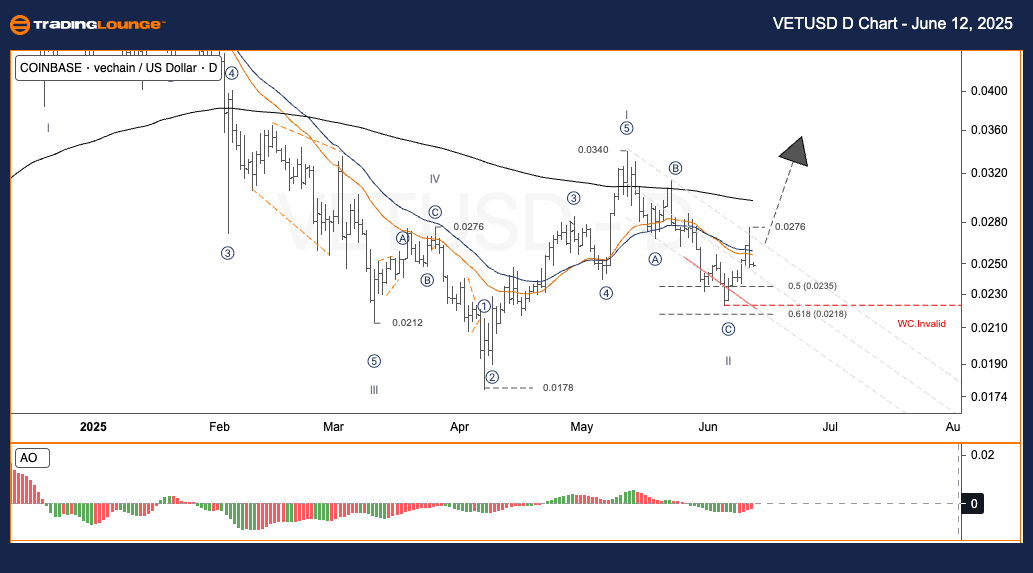
Wave Position: Wave II
Wave Cancel (Invalidation) Level: Not specified
Market Overview:
After completing an ABC corrective structure, Vechain (VETUSD) initiated an impulsive move upward, finishing wave (1). Currently, the asset is expected to begin wave (2), typically forming an ABC retracement pattern. This potential pullback often acts as a base-building phase before a continued bullish trend resumes.
Trading Strategy – VETUSD
- Short-Term Approach (Swing Trade):
✅ Monitor price action as it moves into the anticipated wave (2) retracement zone.
✅ Confirm trade entries using a clear bullish setup or pattern.
🟥 Place stop-loss orders below $0.02220 to minimize downside risk.
Vechain (VETUSD) Elliott Wave Technical Analysis 4-Hour Chart Analysis – TradingLounge
Function: Follow Trend
Mode: Motive
Structure: Impulse
Wave Position: Wave II
Wave Cancel (Invalidation) Level: Not specified
Short-Term View:
Price movement on the 4-hour chart aligns with the daily Elliott Wave structure. Wave (1) appears complete, and wave (2) is developing. Traders should remain patient, waiting for confirmation of a retracement before initiating any new trades.
Trading Strategy – 4H Chart
✅ Observe for a pullback that aligns with wave (2) territory.
✅ Only enter trades when the price confirms support through structure.
🟥 Recommended stop-loss placement is below $0.02220 to manage risk effectively.
Technical Analyst: Malik Awais
Source: Visit Tradinglounge.com and learn from the Experts. Join TradingLounge Here
Previous: XRPUSD Elliott Wave Technical Analysis
VALUE Offer - $1 for 2 Weeks then $29 a month!Click here
Access 7 Analysts Over 200 Markets Covered. Chat Room With Support
