19Feb

Natural Gas Elliott Wave Analysis & Price Forecast – Technical Chart Analysis, Market Trends and Trading Strategy Insights

Natural Gas Elliott Wave Analysis 

Since shifting to the March 2024 contract, natural gas futures have surged over 29%, nearing full recovery from the previous sell-off. On a broader scale, this suggests the commodity may extend its bullish corrective sequence from February 2024.

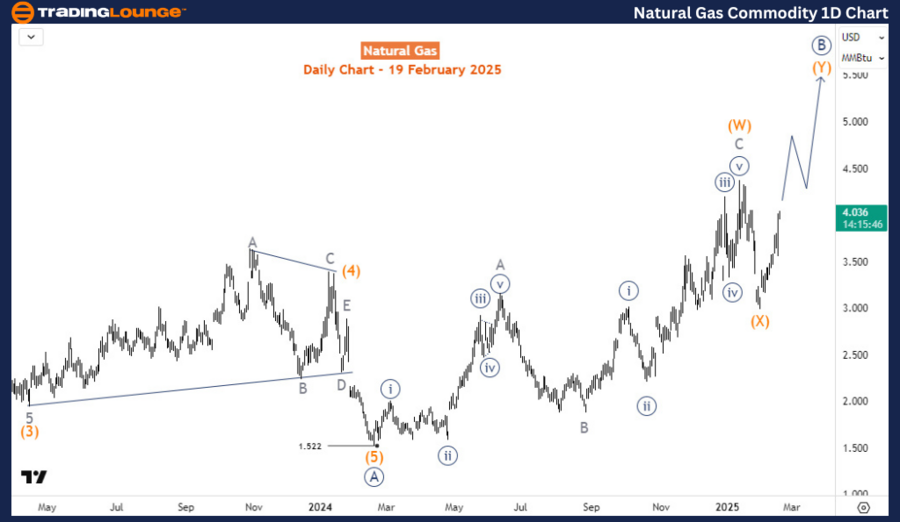
Natural Gas: Daily Chart Analysis

On the daily chart, natural gas remains in a corrective phase that began in February 2024. This level marked the conclusion of a bearish impulse sequence initiated in August 2022, when the commodity traded at $10. Currently, the corrective sequence is shaping into a double zigzag pattern.

  • Wave (W) concluded at its January 2025 peak, leading to a price drop that completed wave (X).
  • Wave (Y) began in the final days of January and is projected to advance toward the $5.7-$6.8 range.

Thus, in the short term, an upside continuation remains the favored outlook. However, unless the wave (W) peak is surpassed, traders should remain cautious about the possibility of a lower wave (X) forming within the double zigzag structure.

Natural-Gas-commodit...


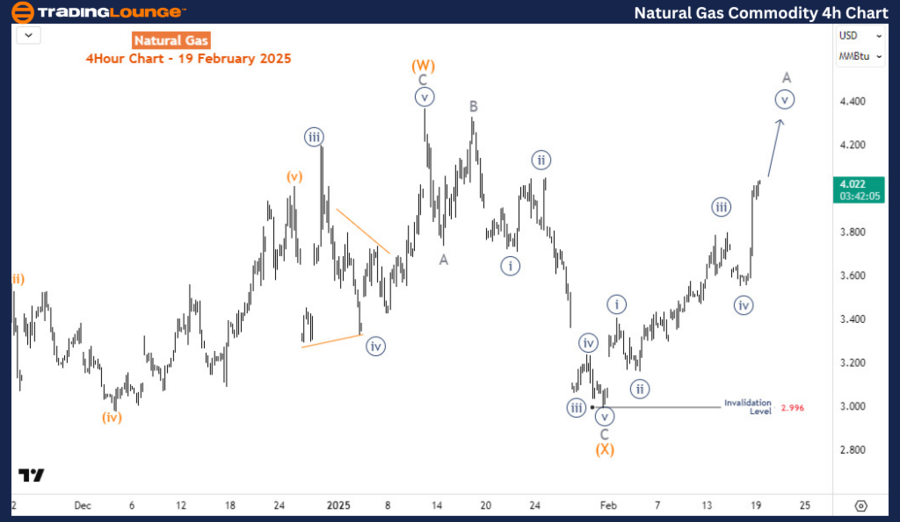
Natural Gas: H4 Chart Analysis

On the H4 chart, natural gas prices are currently in wave A of (Y), forming an impulse wave pattern.

  • Following wave A, a bullish reaction is expected from the wave B pullback.
  • However, based on the current price action, wave A may still extend higher before wave B corrects the movement.

Traders should monitor these key levels as natural gas remains in a bullish corrective phase with potential upward momentum in the coming sessions.

Technical Analyst: Sanmi Adeagbo

Source: visit Tradinglounge.com and learn From the Experts Join TradingLounge Here 

See Previous: Cocoa Elliott Wave Technical Analysis

VALUE Offer - Buy 1 Month & Get 3 Months!Click here

Access 7 Analysts Over 200 Markets Covered. Chat Room With Support

Natural-Gas-commodit...

Related

Polkadot Elliott Wave Technical Forecast: DOT Crypto Price Set for Reversal as Wave 2 Nears Completion with Strong Wave 3 Ahead

Polkadot Elliott Wave Technical Forecast: DOT Crypto Price Set for Reversal as Wave 2 Nears Completion with Strong Wave 3 Ahead

Polkadot (DOT) is in a wave 2 correction phase, with potential bullish reversal near $3.62–$3.94. E...

Read More >
Dogecoin Crypto Price News Today - Elliott Wave Analysis of Dogecoin/USD (DOGEUSD) A Comprehensive Guide

Dogecoin Crypto Price News Today - Elliott Wave Analysis of Dogecoin/USD (DOGEUSD) A Comprehensive Guide

This article offers a comprehensive look at the Dogecoin (DOGEUSD) market through the lens of Elliot...

Read More >
Swiss Market Index (SMI) Elliott Wave Analysis – Bullish Trend, Forecast, Technical Chart, Price Prediction, and Stock Market Outlook

Swiss Market Index (SMI) Elliott Wave Analysis – Bullish Trend, Forecast, Technical Chart, Price Prediction, and Stock Market Outlook

The Swiss Market Index (SMI) continues its bullish Elliott Wave trend, with impulsive wave formation...

Read More >
Detailed Elliott Wave Analysis of ASX Sonic Healthcare Limited (SHL) with Stock Forecasts, Price Targets, and Market Predictions

Detailed Elliott Wave Analysis of ASX Sonic Healthcare Limited (SHL) with Stock Forecasts, Price Targets, and Market Predictions

This detailed Elliott Wave analysis of ASX Sonic Healthcare Limited (SHL) provides insights into the...

Read More >
U.S. Dollar / Japanese Yen (USDJPY) Elliott Wave Forecast: Daily & 4-Hour Bearish Trend Analysis, Wave 3 Formation

U.S. Dollar / Japanese Yen (USDJPY) Elliott Wave Forecast: Daily & 4-Hour Bearish Trend Analysis, Wave 3 Formation

USDJPY remains in a strong bearish trend according to Elliott Wave analysis, with active wave 3 form...

Read More >
Elliott Wave Trading Strategies for SP500, NASDAQ 100, Bitcoin & Leading Tech Stocks

Elliott Wave Trading Strategies for SP500, NASDAQ 100, Bitcoin & Leading Tech Stocks

This blog provides Elliott Wave analysis and trading strategies for SP500, NASDAQ 100, Bitcoin, and ...

Read More >

$1 for 2 Weeks

then $29 a month!

What a Special Offer!

Trade Recommendations

Unleash the power of deversified trading with our comprehensive portfolio, covering 250+ markets:

  • Stock Trades
  • Crypto Trades
  • Forex Trades
  • Commodity Trades
Elliott Wave Analysis

Gain a competitive edge with expert insights and AI-powered Elliott Wave charting into:

  • Global Indices
  • US Stocks & ASX Stocks
  • Forex & Crypto
  • Commodities
Top-Notch Trading Tools

Equip yourself with the tools of success:

  • Real-time Chat rooms
  • Elliott Wave Algorithm
  • Portfolio tools
  • TradingLevels
  • Screener
  • Trading Game
7 Elliott Wave Analysts

Stay ahead of the market with daily charts and insightful videos
Your secret to strategic trading!

JOIN HERE


Welcome to TradingLounge (ASIC A.R.No. 321187), specialists in trades, trading education and technical analysis, covering stocks, indices, commodities, forex and cryptocurrencies.

When you join TradingLounge you have access to everything we offer, including trade tools, educational content and a social platform to chat with like-minded investors.

Read more

@Copyright 2024 by tradinglounge.com

Contact Us

Australian no: 02 4787 6020

International no: +61 (2) 47876020

Pay with:

Find us on