Analog Devices Inc., Elliott Wave Technical Analysis
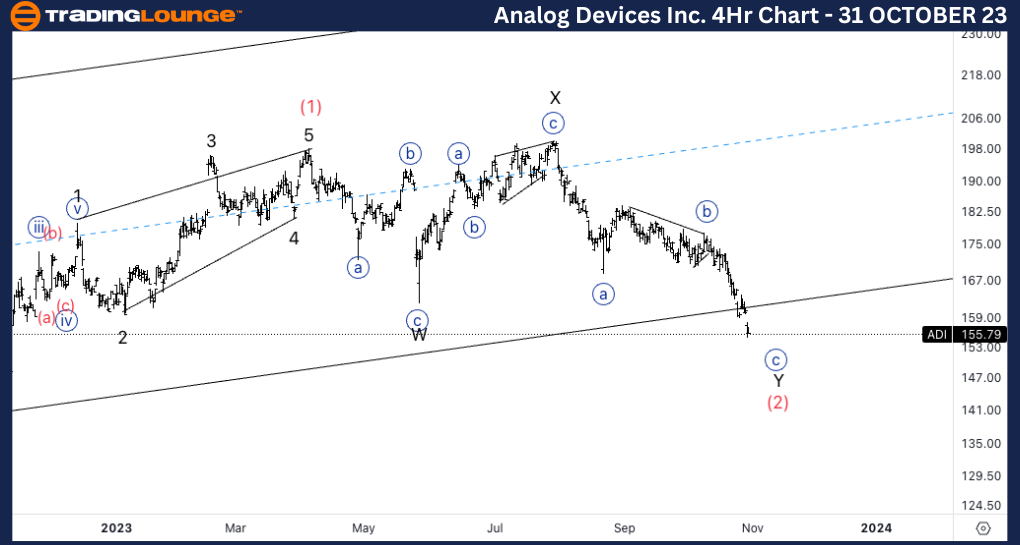
Analog Devices Inc., (ADI:NASDAQ): 4H Chart, 31 October 23
ADI Stock Market Analysis: We have been looking for a wave (2) to take place and we seem to be in the final stages of the correction. We seem to have had a complex correction as we continued to move in three wave structures.
ADI Elliott Wave Count: Wave Y of (C).
ADI Technical Indicators: Below all averages.
ADI Trading Strategy: Looking for longs into wave 1 of (1).
TradingLounge Analyst: Alessio Barretta
Source : Tradinglounge.com get trial here!
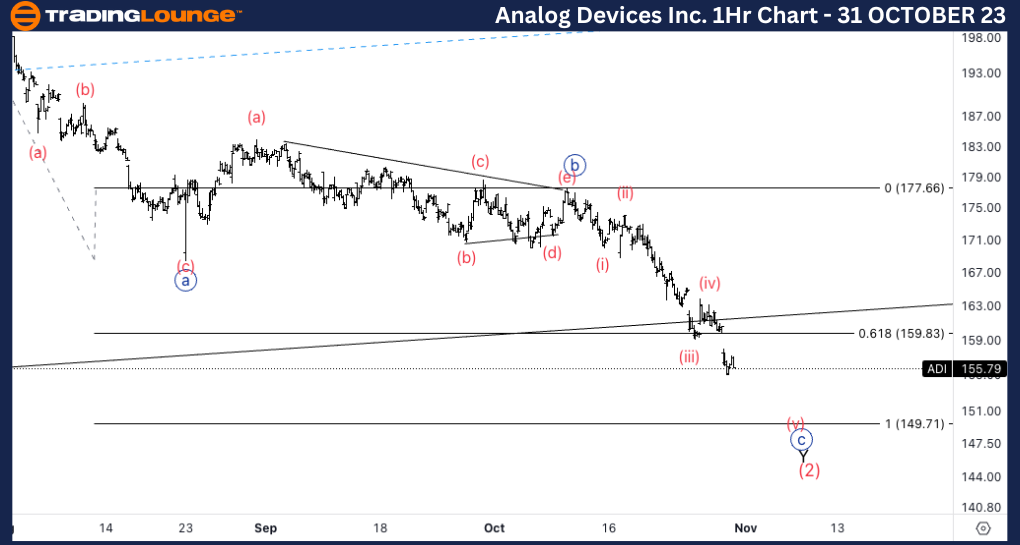
Analog Devices Inc., ADI: 1-hour Chart, 31 October 23
Analog Devices Inc., Elliott Wave Technical Analysis
ADI Stock Market Analysis: Looking for more downside into wave {c} of Y as we have found resistance on the 61.8% of Y vs. W.
ADI Elliott Wave count: Wave (v) of {c}.
ADI Technical Indicators: Below all averages.
ADI Trading Strategy: Looking for shorts into wave (v) toward equality of Y and W.