08Nov

Deere & Co. Stocks Elliott Wave Technical Analysis include DE stock trends, Anticipated Price Targets, and Support Levels.

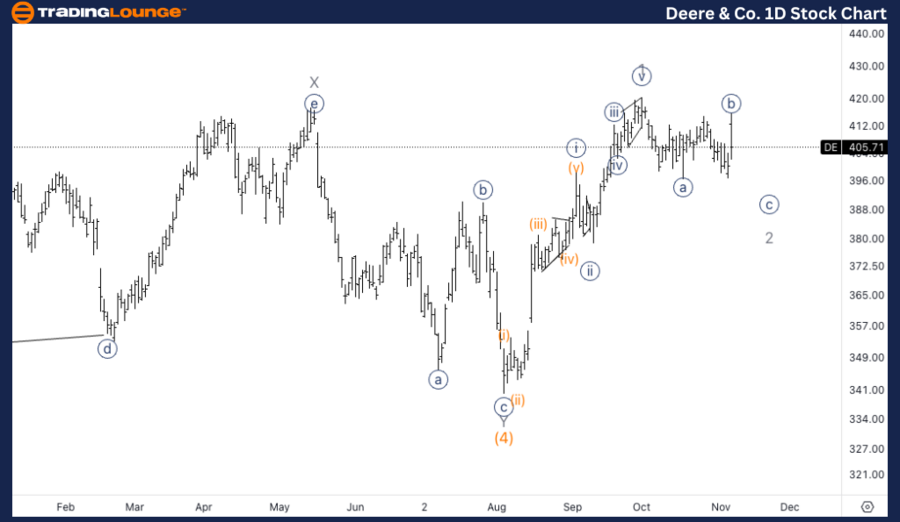
DE Elliott Wave Analysis - Trading Lounge Daily Chart

Deere & Co. (DE) - Daily Chart Analysis

DE Elliott Wave Technical Analysis

Function: Trend

Mode: Impulsive

Structure: Motive

Position: Wave 2 of (5)

Direction: Bottom in Wave 2

Details: A potential bottom in wave (4) seems to have formed near $330 after an extended corrective period over the past few years. Now that DE has broken above the $400 mark, there is a strong indication of further upside, supporting a bullish outlook.

DE Elliott Wave Technical Analysis – Daily Chart

The daily chart for Deere & Co. indicates that wave (4) — a multi-year correction — likely ended near $330. Following a breakout above the key resistance level at $400, a bullish trend appears to be setting up, signaling the start of wave (5). With confirmation from the recent price action, further gains are anticipated as this impulsive wave structure develops. Sustained trading above $400 will reinforce the bullish trend, targeting higher levels in wave 3 of (5).

Deere-&-Co-1D-Stock-...


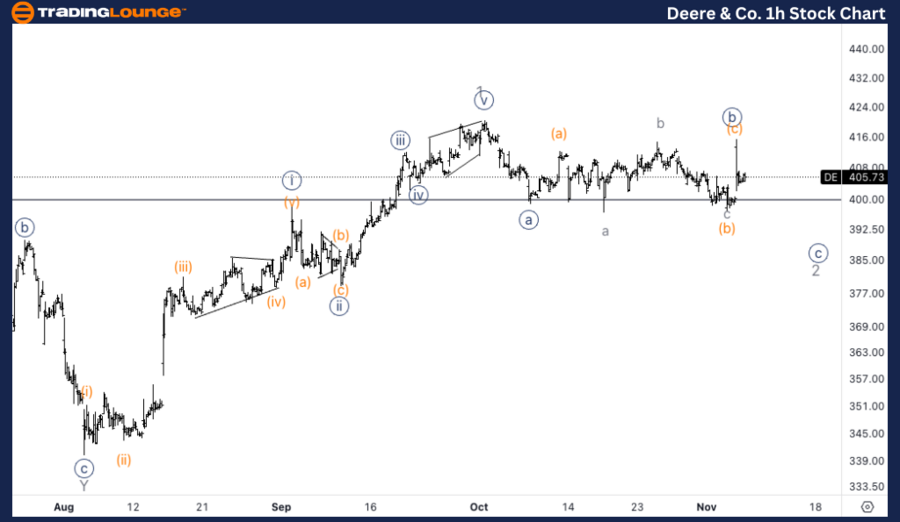
Deere & Co. (DE) - TradingLounge 1H Chart

DE Stock Technical Analysis

Function: Trend

Mode: Impulsive

Structure: Motive

Position: Wave {c} of 2

Direction: Downside in Wave {c}

Details: A further downward move is expected in wave {c} of 2, forming a three-wave corrective structure. The price continues to find support near MediumLevel $400, which has served as a significant level during this correction. The next move lower in wave {c} will be critical in determining if the corrective phase is nearing its end.

DE Elliott Wave Technical Analysis – 1H Chart

The 1-hour chart analysis shows wave 2 unfolding with a probable three-wave correction in progress. A further downside leg in wave {c} of 2 could retest support near the MediumLevel $400. This level has consistently acted as a support zone throughout the correction, and any additional downside action in wave {c} will provide further clarity on whether the correction is nearing its final stages.

Technical Analyst: Alessio Barretta

Source: visit Tradinglounge.com and learn From the Experts Join TradingLounge Here 

See Previous: Eaton Corp PLC (ETN) Elliott Wave Technical Analysis

VALUE Offer - Buy 1 Month & Get 3 Months!Click here

Access 7 Analysts Over 200 Markets Covered. Chat Room With Support

Deere-&-Co-1h-Stock-...

Related

Comprehensive Corn Price Analysis: Corn Commodity Elliott Wave Forecast and Technical Insights into Current Corn Futures Market Trends

Comprehensive Corn Price Analysis: Corn Commodity Elliott Wave Forecast and Technical Insights into Current Corn Futures Market Trends

This article provides an in-depth analysis of corn prices through the lens of Elliott Wave theory. I...

Read More >
Silver XAGUSD Commodity Elliott Wave Technical Analysis: Covers Market Trends, and Offers Strategic Insights

Silver XAGUSD Commodity Elliott Wave Technical Analysis: Covers Market Trends, and Offers Strategic Insights

This article provides an in-depth Silver Elliott Wave analysis, predicting potential price movements...

Read More >
Elliott Wave Technical Analysis of the Dow Jones Industrial Average (DJI), Offering Valuable Insights for Investors and Traders

Elliott Wave Technical Analysis of the Dow Jones Industrial Average (DJI), Offering Valuable Insights for Investors and Traders

This comprehensive guide provides a thorough Elliott Wave Analysis of the Dow Jones Industrial Avera...

Read More >
U.S. Dollar / Japanese Yen (USDJPY) Elliott Wave Analysis: Forex Market Trends & Technical Analysis for Better Trading Decisions

U.S. Dollar / Japanese Yen (USDJPY) Elliott Wave Analysis: Forex Market Trends & Technical Analysis for Better Trading Decisions

USDJPY Elliott Wave analysis examines the current Forex market trends using the Elliott Wave theory....

Read More >
AUDUSD Continues to Display a Strong Bearish Trend in Australian Dollar/U.S. Dollar Forex Elliott Wave Technical Analysis

AUDUSD Continues to Display a Strong Bearish Trend in Australian Dollar/U.S. Dollar Forex Elliott Wave Technical Analysis

The AUDUSD continues to display a strong bearish trend in Elliott Wave analysis, with a key focus on...

Read More >
TASI Index Elliott Wave Analysis: Bullish Trend Forecast and Key Invalidation Level Insights

TASI Index Elliott Wave Analysis: Bullish Trend Forecast and Key Invalidation Level Insights

The TASI Index is currently in a strong bullish phase, as identified by Elliott Wave analysis. With ...

Read More >

$1 for 2 Weeks

then $29 a month!

What a Special Offer!

Trade Recommendations

Unleash the power of deversified trading with our comprehensive portfolio, covering 250+ markets:

  • Stock Trades
  • Crypto Trades
  • Forex Trades
  • Commodity Trades
Elliott Wave Analysis

Gain a competitive edge with expert insights and AI-powered Elliott Wave charting into:

  • Global Indices
  • US Stocks & ASX Stocks
  • Forex & Crypto
  • Commodities
Top-Notch Trading Tools

Equip yourself with the tools of success:

  • Real-time Chat rooms
  • Elliott Wave Algorithm
  • Portfolio tools
  • TradingLevels
  • Screener
  • Trading Game
7 Elliott Wave Analysts

Stay ahead of the market with daily charts and insightful videos
Your secret to strategic trading!

JOIN HERE


Welcome to TradingLounge (ASIC A.R.No. 321187), specialists in trades, trading education and technical analysis, covering stocks, indices, commodities, forex and cryptocurrencies.

When you join TradingLounge you have access to everything we offer, including trade tools, educational content and a social platform to chat with like-minded investors.

Read more

@Copyright 2024 by tradinglounge.com

Contact Us

Australian no: 02 4787 6020

International no: +61 (2) 47876020

Pay with:

Find us on