Elliott Wave Analysis for TRON/US Dollar (TRXUSD): Daily and H4 Chart Overview
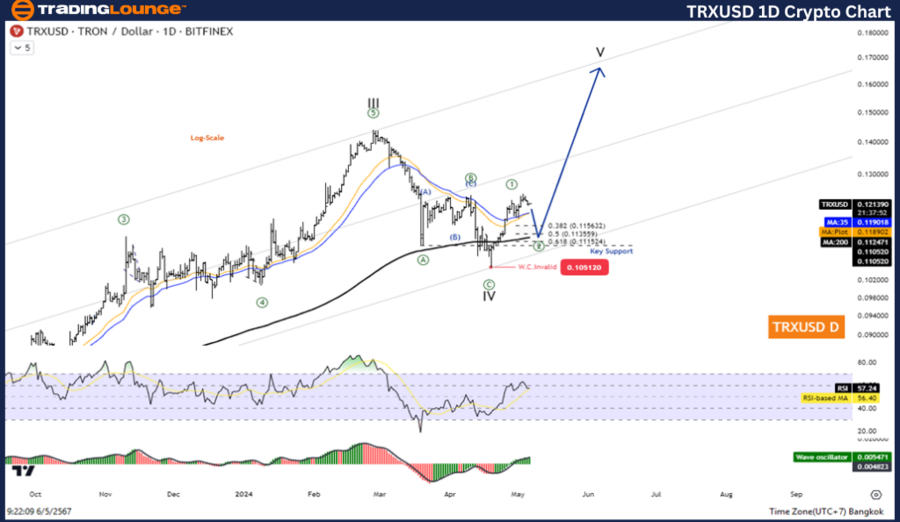
TRXUSD Elliott Wave Technical Analysis
Trading Strategy for TRON/US Dollar (TRXUSD)
TRON continues to showcase strength in its overarching uptrend. The recent corrective phase appears concluded, setting the stage for a rise in the fifth wave. Investors should be mindful of a potential minor pullback before the uptrend resumes. Engaging in this bullish momentum could be profitable.
Technical Indicators for TRON/US Dollar (TRXUSD)
The currency pair stands above the MA200, signaling a robust uptrend. Complementary bullish signals from the Wave Oscillator further affirm the upward trajectory.

Elliott Wave Analysis for TRON/US Dollar (TRXUSD): H4 Chart Specifics
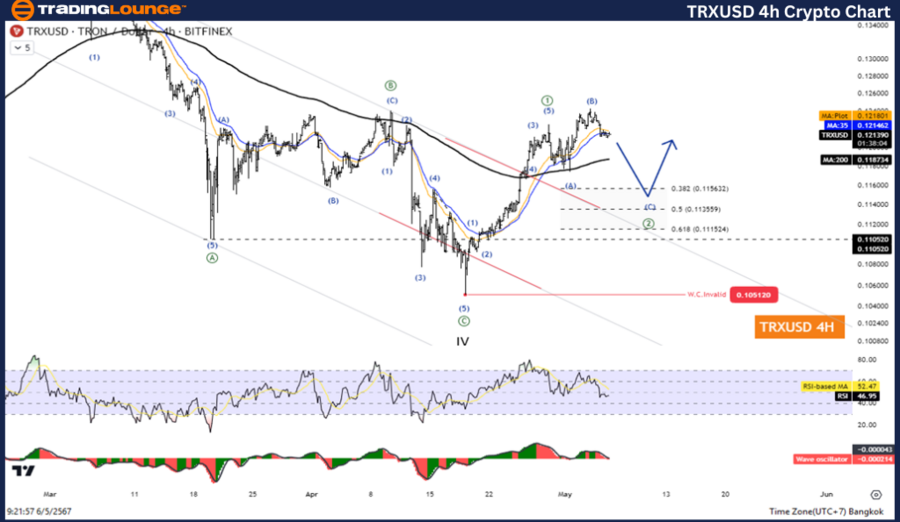
TRXUSD Elliott Wave Technical Analysis
Trading Strategy for TRON/US Dollar (TRXUSD)
Maintaining its position in a bullish market, TRON appears to have moved past its recent correction. The currency is poised for an increase in its fifth wave, although a slight dip could occur beforehand. This presents an opportunity to capitalize on the continued uptrend.
Technical Indicators for TRON/US Dollar (TRXUSD)
Remaining above the MA200 suggests that the uptrend is intact. The bullish momentum is supported by positive readings from the Wave Oscillator, encouraging an optimistic outlook for traders.
By tailoring this content to be SEO-friendly with focused keywords like "Elliott Wave Analysis," "TRXUSD," "technical analysis," and "trading strategy," it can better cater to search engine algorithms and target audiences interested in trading insights for TRON/US Dollar.
Technical Analyst: Kittiampon Somboonsod
Source: visit Tradinglounge.com and learn From the Experts Join TradingLounge Here
Previous: Daily Insights on Binance/US Dollar (BNBUSD)
Special Trial Offer - 0.76 Cents a Day for 3 Months! Click here
Access 6 Analysts covering over 150 Markets. Chat Room With Support
