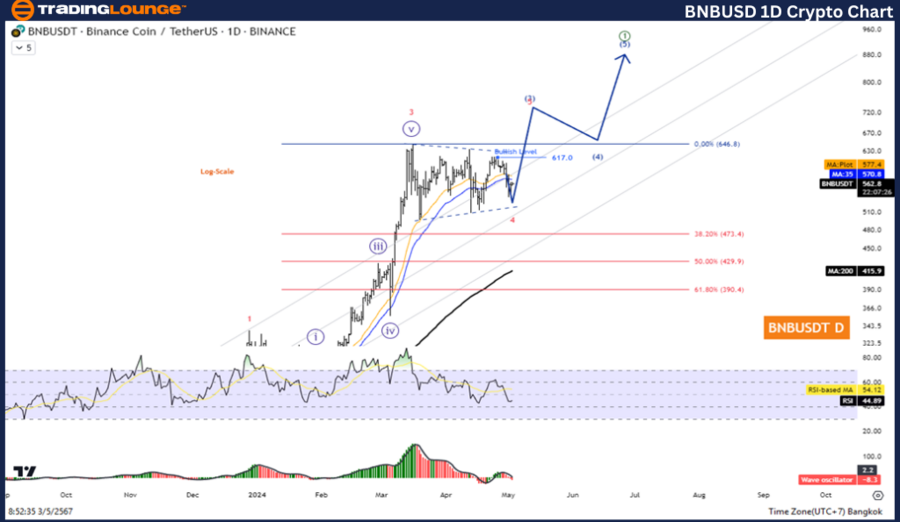
Elliott Wave Analysis: Daily Insights on Binance/US Dollar (BNBUSD)

BNBUSD Elliott Wave Technical Overview

  • Current Trend: Counter Trend

  • Market Condition: Corrective Phase

  • Pattern Analysis: Triangle Formation

  • Current Wave: Wave ((E))

  • Upcoming Movement: Targeting Wave 4

  • Critical Reversal Point: Below 508

Detailed Insight: The BNBUSD pair exhibits a corrective triangle pattern within Wave ((E)) which anticipates an upsurge into Wave 5. This suggests potential upward movement after the current consolidation phase.

Trading Strategy for Binance/US Dollar (BNBUSD)

For traders monitoring the BNBUSD exchange, the ongoing Wave 4 correction presents a strategic pause in the trend. The formation of Wave E in the triangle suggests imminent advancement to Wave 5, recommending a hold until the correction phase concludes. This is an opportune moment to strategize entry points for the expected bullish continuation.

Technical Indicators Overview

The BNBUSD trading scenario appears favorable as indicated by the MA200, with the price maintaining above this key moving average, signaling a strong uptrend. Additionally, the Wave Oscillator showcases bullish momentum, aligning with the uptrend forecast.

BNBUSD-1D-crypto-cha...


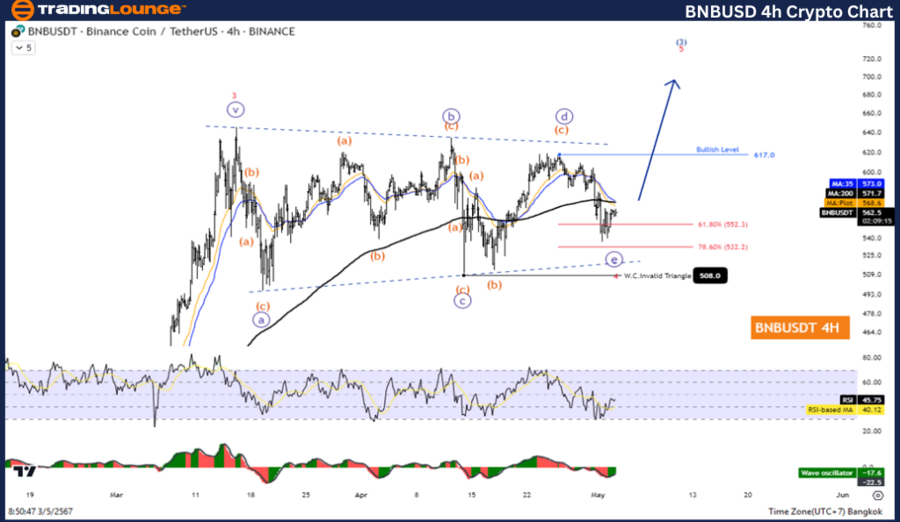
Elliott Wave Analysis: H4 Chart Review for Binance/US Dollar (BNBUSD)

BNBUSD Elliott Wave Technical Snapshot

  • Current Trend: Counter Trend

  • Market Condition: Corrective Phase

  • Pattern Analysis: Triangle Formation

  • Current Wave: Wave ((E))

  • Anticipated Next Movement: Wave 4

  • Key Reversal Level: Below 508

Trading Guidance for Binance/US Dollar (BNBUSD)

As the BNBUSD navigates through the short-term corrective phase characterized by a triangle pattern in Wave 4, it is critical for traders to remain patient. The evolution of Wave E signals potential elevation into Wave 5, where traders should anticipate rejoining the bullish trend post-correction.

Technical Indicators Review

With the BNBUSD position securely above the MA200, the outlook remains bullish. The presence of bullish momentum, as suggested by the Wave Oscillator, further supports the continuation of the upward trajectory.

Technical Analyst: Kittiampon Somboonsod

Source: visit Tradinglounge.com and learn From the Experts Join TradingLounge Here 

Previous: Tron/ U.S. dollar(TRXUSD) Elliott Wave Technical Analysis

Special Trial Offer - 0.76 Cents a Day for 3 Months! Click here

Access 6 Analysts covering over 150 Markets. Chat Room With Support

BNBUSD-4Hr-crypto-ch...

Related

Ethereum Price Prediction and Elliott Wave Forecast: ETHUSD Analysis, and Short-Term Swing Trading Opportunities Explained

Ethereum Price Prediction and Elliott Wave Forecast: ETHUSD Analysis, and Short-Term Swing Trading Opportunities Explained

This analysis covers Ethereum's current trend using Elliott Wave principles. It identifies poten...

Read More >
Elliott Wave Theory to Predict Future Price Movements of McDonald’s (MCD) Stock Utilizes the Elliott Wave Theory

Elliott Wave Theory to Predict Future Price Movements of McDonald’s (MCD) Stock Utilizes the Elliott Wave Theory

This in-depth analysis of McDonald’s (MCD) stock utilizes the Elliott Wave Theory to predict future...

Read More >
ASX:NEM - Newmont Corporation Elliott Wave Analysis, Trading Strategies & ASX Market Trends for Long-Term Investors

ASX:NEM - Newmont Corporation Elliott Wave Analysis, Trading Strategies & ASX Market Trends for Long-Term Investors

Newmont Corporation (ASX: NEM) forecast that highlights critical wave structures, key price levels, ...

Read More >
S&P/TSX 60 Index Elliott Wave Technical Analysis: Valuable insights into market dynamics and future movements

S&P/TSX 60 Index Elliott Wave Technical Analysis: Valuable insights into market dynamics and future movements

This article provides an in-depth Elliott Wave analysis of the S&P/TSX 60 index on both daily and we...

Read More >
Elliott Wave Technical Analysis for Visa Inc.(V) Stocks Predictions, Stock Trends, and Technical Insights

Elliott Wave Technical Analysis for Visa Inc.(V) Stocks Predictions, Stock Trends, and Technical Insights

This article provides an in-depth Elliott Wave analysis of Visa Inc., examining the technical aspect...

Read More >
Polkadot DOTUSD Elliott Wave Analysis Predicts Wave III Bullish Breakout After ABC Correction and Fibonacci Level Confirmation

Polkadot DOTUSD Elliott Wave Analysis Predicts Wave III Bullish Breakout After ABC Correction and Fibonacci Level Confirmation

Polkadot (DOTUSD) may have completed wave II at 3.737 near the 0.618 Fibonacci level. A confirmed br...

Read More >

$1 for 2 Weeks

then $29 a month!

What a Special Offer!

Trade Recommendations

Unleash the power of deversified trading with our comprehensive portfolio, covering 250+ markets:

  • Stock Trades
  • Crypto Trades
  • Forex Trades
  • Commodity Trades
Elliott Wave Analysis

Gain a competitive edge with expert insights and AI-powered Elliott Wave charting into:

  • Global Indices
  • US Stocks & ASX Stocks
  • Forex & Crypto
  • Commodities
Top-Notch Trading Tools

Equip yourself with the tools of success:

  • Real-time Chat rooms
  • Elliott Wave Algorithm
  • Portfolio tools
  • TradingLevels
  • Screener
  • Trading Game
7 Elliott Wave Analysts

Stay ahead of the market with daily charts and insightful videos
Your secret to strategic trading!

JOIN HERE


Welcome to TradingLounge (ASIC A.R.No. 321187), specialists in trades, trading education and technical analysis, covering stocks, indices, commodities, forex and cryptocurrencies.

When you join TradingLounge you have access to everything we offer, including trade tools, educational content and a social platform to chat with like-minded investors.

Read more

@Copyright 2024 by tradinglounge.com

Contact Us

Australian no: 02 4787 6020

International no: +61 (2) 47876020

Pay with:

Find us on