British Pound/ U.S. Dollar (GBPUSD) Elliott Wave Analysis - Trading Lounge Day Chart
GBPUSD Elliott Wave Technical Analysis
Function: Counter Trend
Mode: Impulsive
Structure: Orange wave 5
Position: Navy blue wave 5 of C
Direction (Next Higher Degrees): Navy blue wave 1 (New bullish trend)
Details
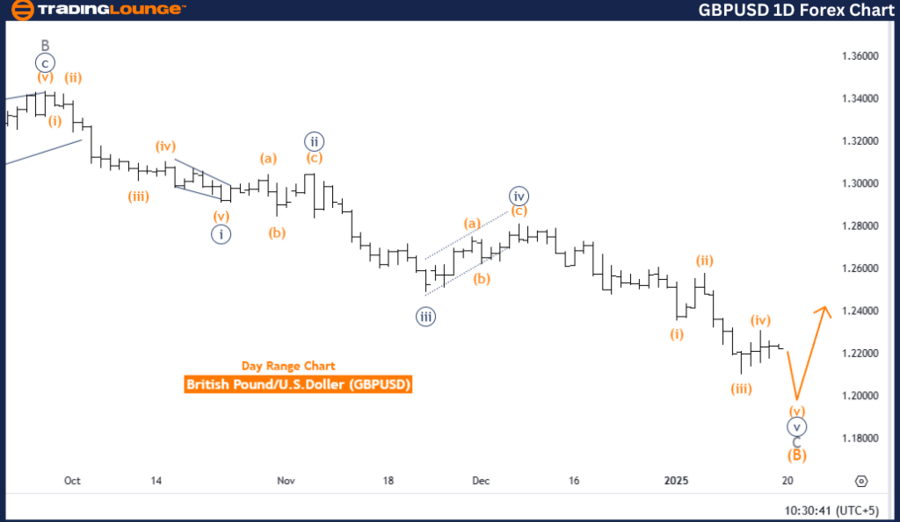
The GBPUSD daily chart showcases a counter-trend phase as interpreted through Elliott Wave Analysis. The ongoing wave structure reveals an impulsive formation, highlighting the progression of orange wave five, a component of the broader corrective cycle. This segment is identified as navy blue wave five of C, marking the final stage of the ongoing correction.
The completion of orange wave four sets the foundation for orange wave five to unfold. This development signifies the end of the corrective phase, preparing the market for a potential shift into a new bullish trend, which will commence with navy blue wave one on a higher degree.
An invalidation level is pinpointed at 1.23089. If the price descends below this critical level, the current wave pattern will be invalidated, necessitating a reevaluation of the Elliott Wave scenario. This threshold serves as a pivotal marker for confirming the wave progression.
Summary
The GBPUSD daily chart underscores the development of orange wave five within an impulsive counter-trend movement. With orange wave four completed, the stage is set for the concluding phase of the correction, marked by navy blue wave five of C. Upon completion of this cycle, the market is projected to transition into a new bullish trend, led by navy blue wave one.
Maintaining the price above the invalidation level of 1.23089 is crucial for validating the current wave structure and aligning with the anticipated bullish outlook. Traders should monitor the progress of orange wave five and ensure the price remains above the invalidation threshold to confirm the expected reversal.
British Pound/ U.S. Dollar (GBPUSD) Elliott Wave Analysis - Trading Lounge 4-Hour Chart
GBPUSD Elliott Wave Technical Analysis
Function: Counter Trend
Mode: Impulsive
Structure: Orange wave 5
Position: Navy blue wave 5 of C
Direction (Next Higher Degrees): Orange wave 1 (New bullish trend)
Details
The GBPUSD four-hour chart provides a closer look at the counter-trend phase within the framework of Elliott Wave Analysis. The current wave sequence highlights an impulsive movement, focusing on orange wave five, which forms a crucial part of the larger corrective structure. This aligns with navy blue wave five of C, representing the final phase of the correction.
Following the completion of orange wave four, the market has established the groundwork for orange wave five to develop. This wave marks a critical juncture in the counter-trend phase, signaling the end of the corrective sequence. Upon the completion of orange wave five and navy blue wave C, the market is expected to pivot into a new bullish trend, starting with orange wave one at a higher degree.
The invalidation level, located at 1.23089, is vital for maintaining the integrity of the wave pattern. A drop below this level would invalidate the current structure, prompting a reassessment of the Elliott Wave framework. This level is integral for confirming the continuity of the wave progression.
Summary
The GBPUSD four-hour chart highlights the formation of orange wave five, which is developing as navy blue wave five of C within an impulsive counter-trend movement. The conclusion of orange wave four has paved the way for the final leg of the corrective phase, setting the stage for a potential bullish trend led by orange wave one.
The invalidation level of 1.23089 serves as a critical benchmark for validating the wave structure and ensuring alignment with the anticipated market transition. Monitoring the progress of orange wave five and maintaining the price above the invalidation threshold are essential to confirming the projected bullish trend.
Technical Analyst: Malik Awais
Source: visit Tradinglounge.com and learn From the Experts Join TradingLounge Here
Previous: USDJPY Elliott Wave Technical Analysis
VALUE Offer - Buy 1 Month & Get 3 Months!Click here
Access 7 Analysts Over 200 Markets Covered. Chat Room With Support