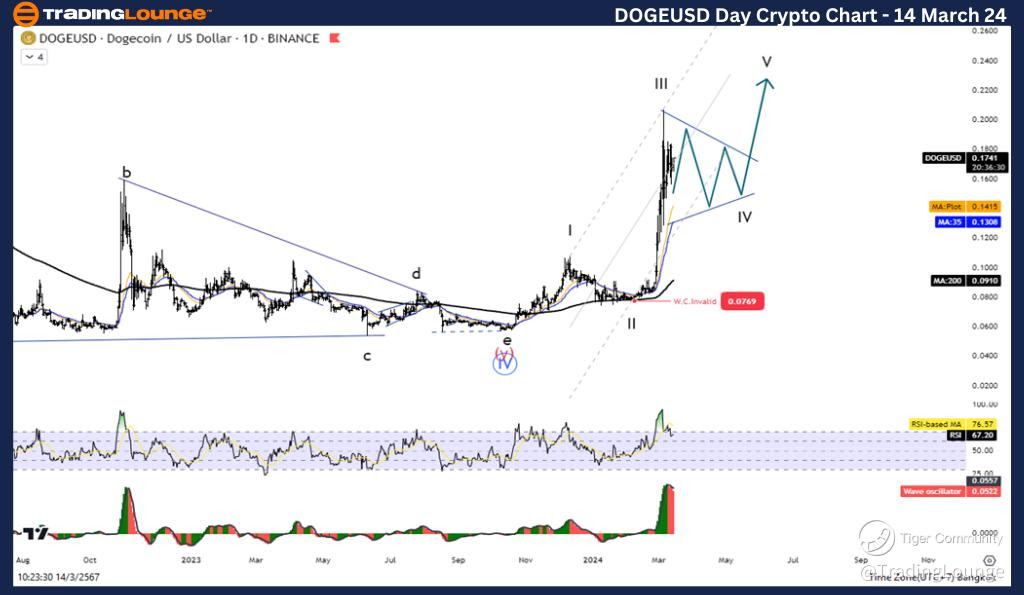
DOGEUSD Elliott Wave Analysis TradingLounge Daily Chart,
In the realm of cryptocurrency trading, understanding market trends and patterns is paramount for success. Leveraging Elliott Wave Analysis can provide invaluable insights into the market dynamics of assets like Dogecoin/ U.S. dollar (DOGEUSD). Here's a detailed breakdown of the Elliott Wave Technical Analysis for DOGEUSD on both daily and 4-hour charts for March 14, 2024.Dogecoin/ U.S. dollar(DOGEUSD)
DOGEUSD Elliott Wave Technical Analysis
Dogecoin/ U.S. dollar(DOGEUSD) Daily Chart Analysis
Function: Follow Trend
Mode: Motive
Structure: Impulse
Position: Wave III
Direction Next Higher Degrees: Wave (I) of Impulse
Wave Cancel Invalid Level: 0.0770
Dogecoin/ U.S. dollar(DOGEUSD) Key Insights:
- Wave III may be complete, signalling a potential corrective phase ahead.
- Traders should remain vigilant for the upcoming corrective wave.
Dogecoin/ U.S. dollar(DOGEUSD) Trading Strategy:
With Dogecoin poised for a correction following the surge of Wave III, traders should exercise patience. Anticipate a period of correction in wave 4 before the onset of wave 5, signalling a continuation of the uptrend. It's advisable to wait for the correction to complete before re-entering the trend to maximize profitability.
Dogecoin/ U.S. dollar(DOGEUSD) Technical Indicators:
- Price is above the MA200, indicating a robust uptrend.
- The Wave Oscillator reflects bullish momentum, reinforcing the potential for further upward movement.
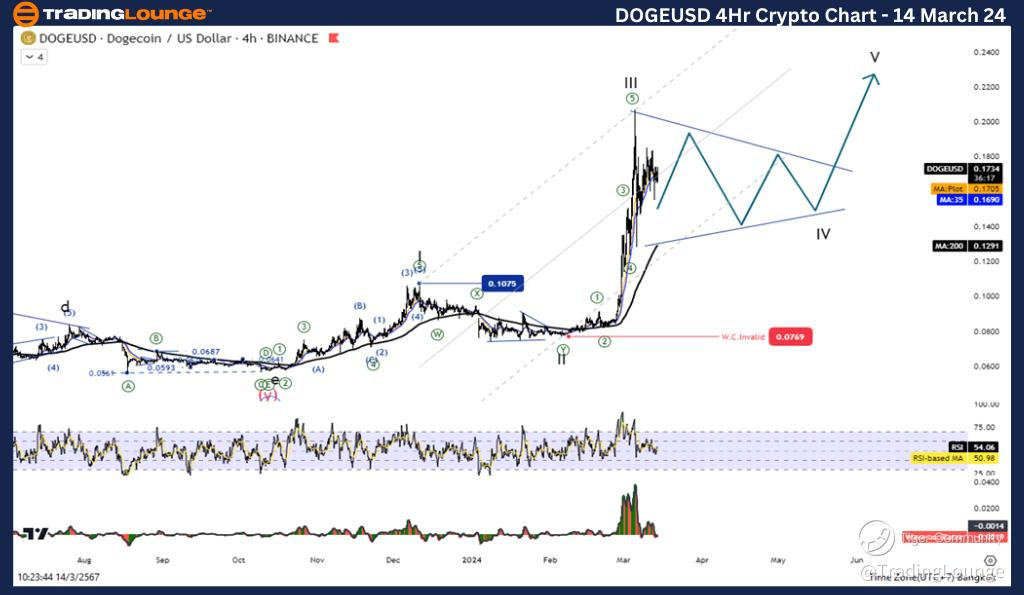
DOGEUSD Elliott Wave Analysis TradingLounge 4Hr Chart, 14 March 24,
Dogecoin/ U.S. dollar(DOGEUSD) 4Hr Chart Analysis
DOGEUSD Elliott Wave Technical Analysis
Function: Follow Trend
Mode: Motive
Structure: Impulse
Position: Wave III
Direction Next Higher Degrees: Wave (I) of Impulse
Wave Cancel Invalid Level: 0.0770
Key Insights:
- Similar to the daily chart analysis, Wave III may be reaching its culmination, suggesting an impending corrective phase.
DOGEUSD Trading Strategy:
Traders should anticipate a correction in Wave 4 following the surge of Wave III, paving the way for Wave 5. Exercise caution and wait for the correction to complete before considering re-entry into the uptrend, maximizing profit potential.
DOGEUSD Technical Indicators:
- Price remains above the MA200, reinforcing the bullish sentiment.
- The Wave Oscillator indicates strong bullish momentum, supporting the likelihood of further upward movement.
In conclusion, employing Elliott Wave Analysis provides invaluable insights into the intricate market dynamics of DOGEUSD. By carefully analyzing both daily and 4-hour charts, traders can formulate informed strategies to capitalize on market movements effectively. Remember to exercise patience, wait for confirmatory signals, and leverage technical indicators to optimize trading decisions and maximize profits in the volatile world of cryptocurrency trading.
Technical Analyst: Kittiampon Somboonsod, CEWA
Source: visit Tradinglounge.com and learn From the Experts Join TradingLounge Here
See Previous: Dogecoin/ U.S. dollar(DOGEUSD)
TradingLounge Once Off SPECIAL DEAL: Here > 1 month Get 3 months.