USDCHF Elliott Wave Analysis – Trading Lounge Daily Chart
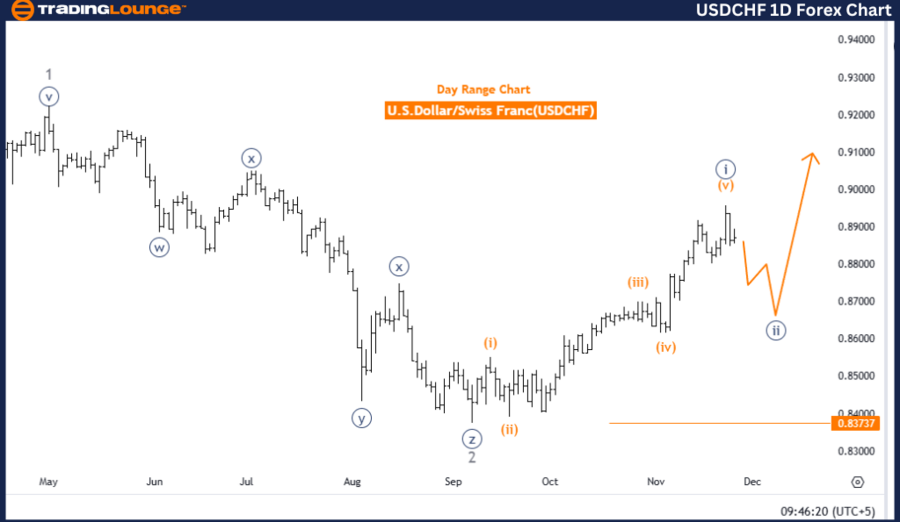
U.S. Dollar/Swiss Franc (USDCHF) – Daily Chart Analysis
USDCHF Elliott Wave Technical Analysis
Function: Counter Trend
Mode: Corrective
Structure: Navy Blue Wave 2
Position: Gray Wave 3
Direction of Next Higher Degrees: Navy Blue Wave 3
Details
The USDCHF pair is analyzed using the Elliott Wave theory, focusing on its daily chart. Currently, the pair is undergoing a counter-trend phase, indicating a temporary reversal within the broader market trend. Navy blue wave 1 appears to have completed, and navy blue wave 2 is in progress as part of a corrective structure.
At this stage, the price is situated within gray wave 3, which represents a smaller corrective movement within the overarching navy blue wave 2. This phase continues the counter-trend motion, with further development expected before the pair transitions to navy blue wave 3, signaling a higher-degree impulsive trend resumption.
Key Threshold – Invalidation Level: 0.83737
The invalidation level for this analysis is set at 0.83737. If the price reaches this point, the current wave count becomes invalid. This threshold serves as a critical benchmark for traders to manage risks and validate the ongoing corrective wave.
Conclusion
The Elliott Wave analysis indicates that USDCHF remains in a corrective counter-trend phase, with navy blue wave 2 actively unfolding. The transition from navy blue wave 1 initiated this phase, and gray wave 3 illustrates its current activity. The analysis remains valid above the invalidation level of 0.83737, anticipating further corrective movement before the emergence of the impulsive navy blue wave 3 phase.
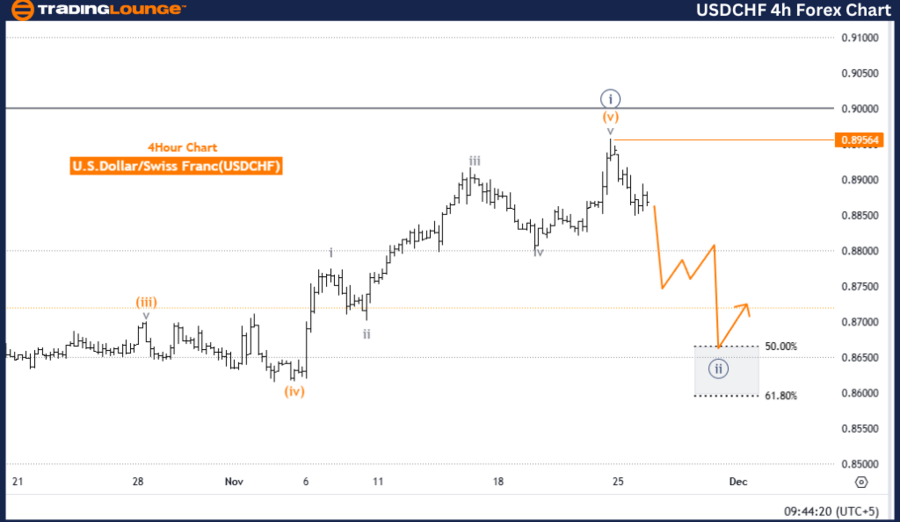
U.S. Dollar/Swiss Franc (USDCHF) – 4-Hour Chart Analysis
USDCHF Forex Pair Technical Analysis
Function: Counter Trend
Mode: Corrective
Structure: Navy Blue Wave 2
Position: Gray Wave 3
Direction of Next Higher Degrees: Navy Blue Wave 3
Details
This analysis applies the Elliott Wave theory to the USDCHF 4-hour chart. The pair remains in a counter-trend phase, signaling a short-term reversal within the dominant market trend. The primary structure under evaluation is navy blue wave 2, which began following the completion of navy blue wave 1.
The current price position lies within gray wave 3, part of the larger navy blue wave 2 corrective structure. This phase continues the counter-trend development, with additional activity expected before the market transitions into navy blue wave 3, resuming the higher-degree impulsive trend.
Key Threshold – Invalidation Level: 0.89564
The invalidation level for this wave count is set at 0.89564. If the price falls to this level, the analysis will be deemed invalid. Traders can use this level as a critical reference to reassess positions and ensure effective risk management.
Conclusion
According to the Elliott Wave analysis, USDCHF is currently progressing through a corrective counter-trend phase, with navy blue wave 2 actively unfolding. The corrective structure began after navy blue wave 1 and is currently in gray wave 3. The analysis remains intact as long as the price holds above 0.89564, forecasting continued corrective activity before transitioning to the impulsive navy blue wave 3 phase.
Technical Analyst: Malik Awais
Source: visit Tradinglounge.com and learn From the Experts Join TradingLounge Here
Previous: GBPJPY Elliott Wave Technical Analysis
VALUE Offer - Buy 1 Month & Get 3 Months!Click here
Access 7 Analysts Over 200 Markets Covered. Chat Room With Support