TradingLounge Coffee Commodity Elliott Wave Analysis

Coffee Elliott Wave Technical Analysis

Coffee prices are starting to shift lower after forming a key technical pattern. Since October 2023, coffee has been in a strong uptrend, but a corrective decline now seems likely before the next upward movement continues. This analysis discusses the potential for a pullback and identifies important levels where the next bullish leg could emerge.

Long-Term Chart Analysis

Coffee prices have historically traded within a broad range, with support between $40 and $55 and resistance from $276 to $337. The current bullish cycle for coffee began in May 2019, marking the start of a significant upward trend. The first phase of this cycle peaked in February 2022 when prices hit significant highs. A corrective second phase followed, which ended with a low in January 2023. After this bottom, the third and ongoing phase of the bullish cycle began, evolving within a larger corrective pattern, consistent with the broader Elliott Wave structure.

The current price action suggests that this third phase is developing as a corrective wave within a larger impulse that began in 2019. While further gains may occur, a substantial pullback is anticipated before the next upward leg continues.

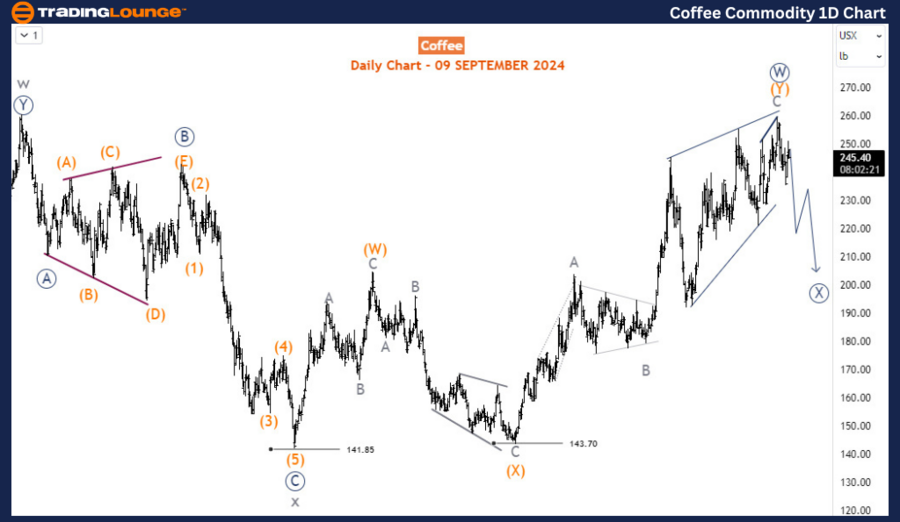
Coffee Commodity Daily Chart Analysis

On the daily chart, the third phase of the recovery completed its first leg, wave (W), in April 2023. This was followed by a three-wave corrective structure, wave (X), which ended at 143.70 in October 2023, establishing support at that level. The next rally, representing wave (Y) of the primary degree wave W (circled), completed the bullish phase.

Wave (Y) of W (circled) appears to have formed an ending diagonal, signaling the exhaustion of the uptrend. With this structure likely completed, a corrective pullback in wave X (circled) is expected. This correction could unfold as a double zigzag, a complex pattern that typically suggests further downside before the uptrend resumes.

Coffee-1d-Commodity-...


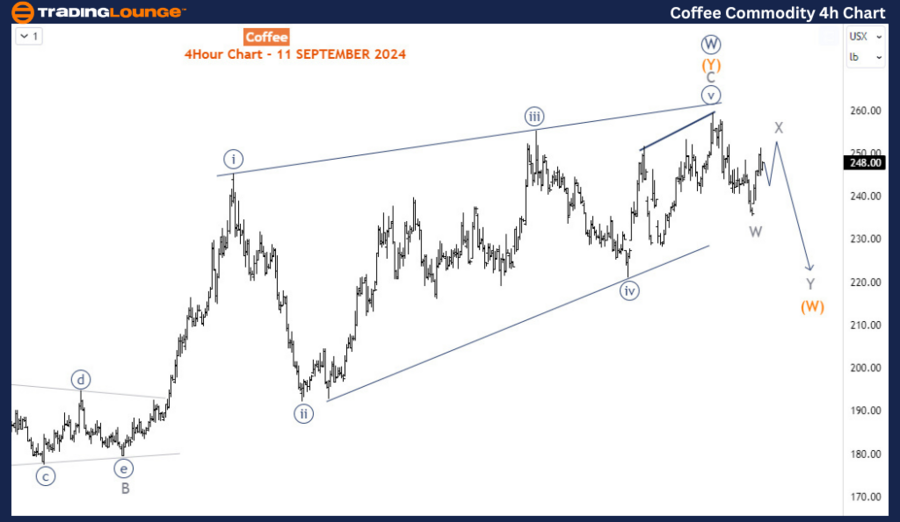
Coffee Commodity H4 Chart Analysis

On the H4 chart, wave (Y) of W (circled) has finished a diagonal pattern, indicating that the rally is losing momentum. The immediate decline can be identified as wave W of (W) of Y (circled), the first phase of the larger corrective structure. A bounce in wave X is expected but is likely to remain below the August 2024 high. Once this bounce completes, another decline in wave Y of (W) is likely, concluding the initial correction phase.

In summary, while the long-term trend for coffee remains bullish, the market is currently undergoing a bearish retracement that could continue in the coming weeks. This corrective phase will likely persist as long as the August 2024 high remains unbroken, offering traders a chance to reevaluate positions before the next major rally.

Technical Analyst: Sanmi Adeagbo

Source: visit Tradinglounge.com and learn From the Experts Join TradingLounge Here 

See Previous: Silver (XAGUSD) Elliott Wave Technical Analysis

Special Trial Offer - 0.76 Cents a Day for 3 Months! Click here

Access 7 Analysts Over 200 Markets Covered. Chat Room With Support

Coffee-4h-Commodity-...

Related

WTC Stock with Precise Technical Chart Analysis and Expert Market Forecasts: WiseTech Global Limited Elliott Wave Technical Forecast

WTC Stock with Precise Technical Chart Analysis and Expert Market Forecasts: WiseTech Global Limited Elliott Wave Technical Forecast

Explore our comprehensive Elliott Wave analysis of WiseTech Global Limited (WTC) on the ASX. Underst...

Read More >
British Pound/Japanese Yen(GBPJPY) Elliottwave Technical analysis - A Comprehensive Overview for Day and 4-Hour Charts

British Pound/Japanese Yen(GBPJPY) Elliottwave Technical analysis - A Comprehensive Overview for Day and 4-Hour Charts

This comprehensive guide offers an in-depth Elliott Wave analysis of the GBPJPY currency pair, provi...

Read More >
CSX Corp. (CSX) U.S. Stocks Elliott Wave Technical Daily & 1‑Hour Analysis: Wave 3 Bullish, $33 Top, $30 Retracement Setup

CSX Corp. (CSX) U.S. Stocks Elliott Wave Technical Daily & 1‑Hour Analysis: Wave 3 Bullish, $33 Top, $30 Retracement Setup

This CSX Elliott Wave analysis covers both daily and 1‑hour charts. On the daily timeframe, CSX is ...

Read More >
MARA Holdings Inc. (MARA) U.S. Stocks Elliott Wave Technical Analysis: Shows Bullish Price Move and Weekly Resistance Nearing

MARA Holdings Inc. (MARA) U.S. Stocks Elliott Wave Technical Analysis: Shows Bullish Price Move and Weekly Resistance Nearing

This analysis of MARA Holdings uses Elliott Wave theory to project price moves on daily and weekly c...

Read More >
DOW JONES (DJI) Index Elliott Wave Technical Analysis Identifies Current Market Trends Help Traders to Navigate Movements

DOW JONES (DJI) Index Elliott Wave Technical Analysis Identifies Current Market Trends Help Traders to Navigate Movements

DOW JONES (DJI) Elliott Wave Analysis identifies current market trends and wave patterns to help tra...

Read More >

$1 for 2 Weeks

then $29 a month!

What a Special Offer!

Trade Recommendations

Unleash the power of deversified trading with our comprehensive portfolio, covering 250+ markets:

  • Stock Trades
  • Crypto Trades
  • Forex Trades
  • Commodity Trades
Elliott Wave Analysis

Gain a competitive edge with expert insights and AI-powered Elliott Wave charting into:

  • Global Indices
  • US Stocks & ASX Stocks
  • Forex & Crypto
  • Commodities
Top-Notch Trading Tools

Equip yourself with the tools of success:

  • Real-time Chat rooms
  • Elliott Wave Algorithm
  • Portfolio tools
  • TradingLevels
  • Screener
  • Trading Game
7 Elliott Wave Analysts

Stay ahead of the market with daily charts and insightful videos
Your secret to strategic trading!

JOIN HERE


Welcome to TradingLounge (ASIC A.R.No. 321187), specialists in trades, trading education and technical analysis, covering stocks, indices, commodities, forex and cryptocurrencies.

When you join TradingLounge you have access to everything we offer, including trade tools, educational content and a social platform to chat with like-minded investors.

Read more

@Copyright 2024 by tradinglounge.com

Contact Us

Australian no: 02 4787 6020

International no: +61 (2) 47876020

Pay with:

Find us on