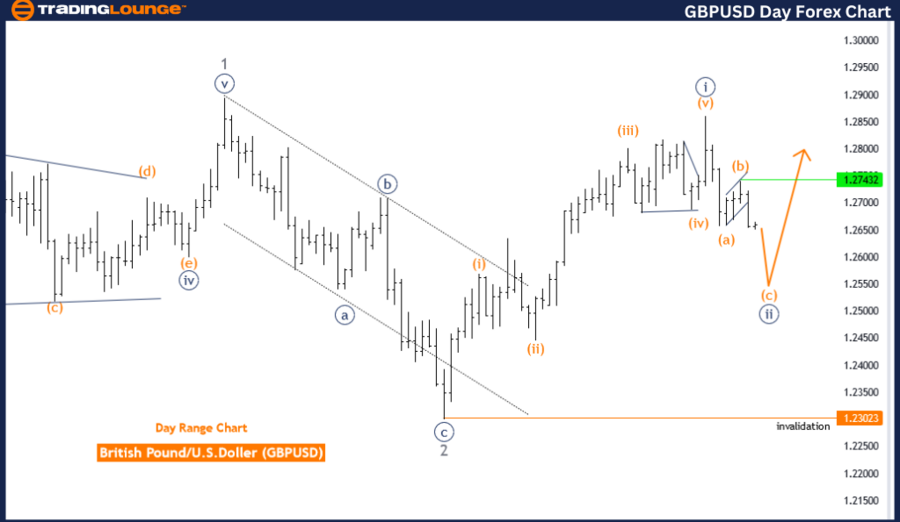
GBPUSD Elliott Wave Analysis Trading Lounge Day Chart
British Pound/U.S. Dollar (GBPUSD) Day Chart Analysis
GBPUSD Elliott Wave Technical Analysis
FUNCTION: Trend
MODE: Corrective
STRUCTURE: Orange wave C
POSITION: Navy blue wave 2
DIRECTION NEXT HIGHER DEGREES: Navy blue wave 3
DETAILS: Orange wave B completed, now orange wave C of 2 is in play.
Wave Cancel Invalid Level: 1.23023
The GBPUSD Elliott Wave analysis on the daily chart explores the current market trend using Elliott Wave theory, focusing on a corrective phase. This analysis centers on the orange wave C within the broader structure of navy blue wave 2, aiming to track and predict market movements during this corrective period.
In Elliott Wave terms, a corrective mode represents a temporary deviation from the main trend, characterized by retracement or consolidation phases. The structure being analyzed is the orange wave C, part of the larger corrective navy blue wave 2. The anticipated direction for the next higher degrees is navy blue wave 3, indicating an upward trend continuation after the corrective phase ends.
The analysis shows that orange wave B appears to be completed, signaling a shift to orange wave C of navy blue wave 2. This suggests that while the market remains in the corrective phase, it is moving towards its conclusion. The completion of orange wave B means the market is now experiencing orange wave C, a crucial part of the corrective pattern.
A significant aspect of this analysis is the wave cancel invalid level, set at 1.23023. This level is vital for confirming the current wave count and maintaining the Elliott Wave structure's integrity. If the market price drops below this level, it would invalidate the current wave analysis, prompting a re-evaluation and potentially altering the market outlook.
Key Takeaways:
- The GBPUSD daily chart indicates the market is in a corrective phase, specifically within orange wave C of navy blue wave 2.
- The completion of orange wave B suggests progress towards the end of this corrective phase.
- The wave cancel invalid level at 1.23023 is critical for validating the current wave structure and guiding future market expectations.
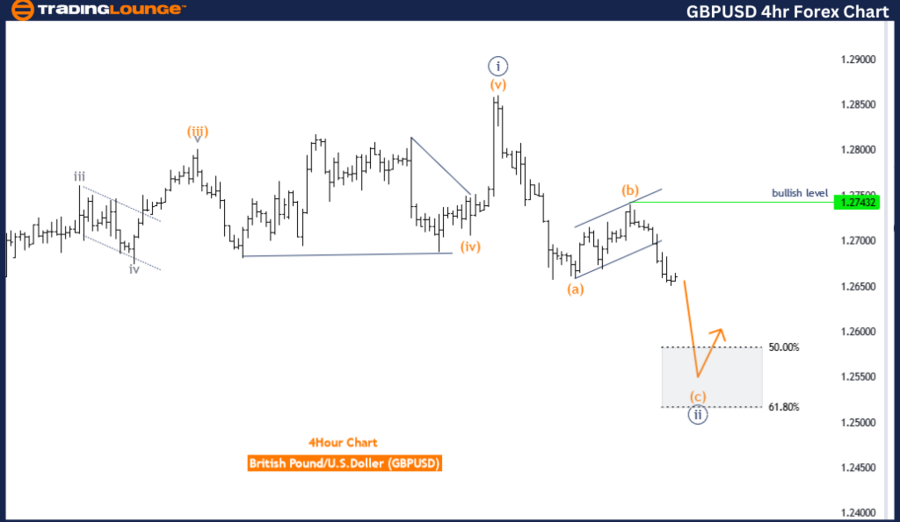
GBPUSD Elliott Wave Analysis Trading Lounge 4-Hour Chart
British Pound/U.S. Dollar (GBPUSD) 4-Hour Chart Analysis
GBPUSD Elliott Wave Technical Analysis
FUNCTION: Trend
MODE: Corrective
STRUCTURE: Orange wave C
POSITION: Navy blue wave 2
DIRECTION NEXT HIGHER DEGREES: Navy blue wave 3
DETAILS: Orange wave B completed, now orange wave C of 2 is in play.
Wave Cancel Invalid Level: 1.23023
The GBPUSD Elliott Wave analysis on the 4-hour chart provides insights into the current market trend using Elliott Wave theory, highlighting a corrective mode within the larger trend structure. This analysis focuses on the orange wave C, positioned within the navy blue wave 2, aiming to understand and predict ongoing trend movements.
In the context of Elliott Wave theory, a corrective mode indicates a temporary counter-trend movement interrupting the primary trend direction. The structure being analyzed is orange wave C, part of the larger navy blue wave 2. The overall trend direction for the next higher degrees is navy blue wave 3, suggesting an upward trend continuation after the current corrective phase ends.
The analysis reveals that orange wave B appears to be completed, and the market is now navigating through orange wave C of navy blue wave 2. This suggests the market is still within the corrective phase, but the completion of orange wave B indicates progress towards the end of this phase. Once orange wave C concludes, the market is expected to transition into the next impulsive phase, navy blue wave 3, resuming the upward trend.
A critical aspect of this analysis is the wave cancel invalid level, set at 1.23023. This level serves as a crucial benchmark for confirming the current wave structure. If the market price falls below this level, it would invalidate the existing wave count, necessitating a re-evaluation of the Elliott Wave analysis and potentially altering the market outlook.
Key Takeaways:
- The GBPUSD 4-hour chart indicates the market is in a corrective phase within orange wave C of navy blue wave 2.
- The completion of orange wave B suggests progress towards the end of the corrective phase.
- The wave cancel invalid level at 1.23023 is crucial for validating the current wave count and guiding future market expectations.
Technical Analyst: Malik Awais
Source: visit Tradinglounge.com and learn From the Experts Join TradingLounge Here
Previous: NZDUSD Elliott Wave Technical Analysis
Special Trial Offer - 0.76 Cents a Day for 3 Months! Click here
Access 7 Analysts Over 170 Markets Covered. Chat Room With Support