25Mar

BTCUSD Crypto Price Elliott Wave Technical Analysis and News Today : Key Reversal Zones & Short-Term Bitcoin Price Strategy

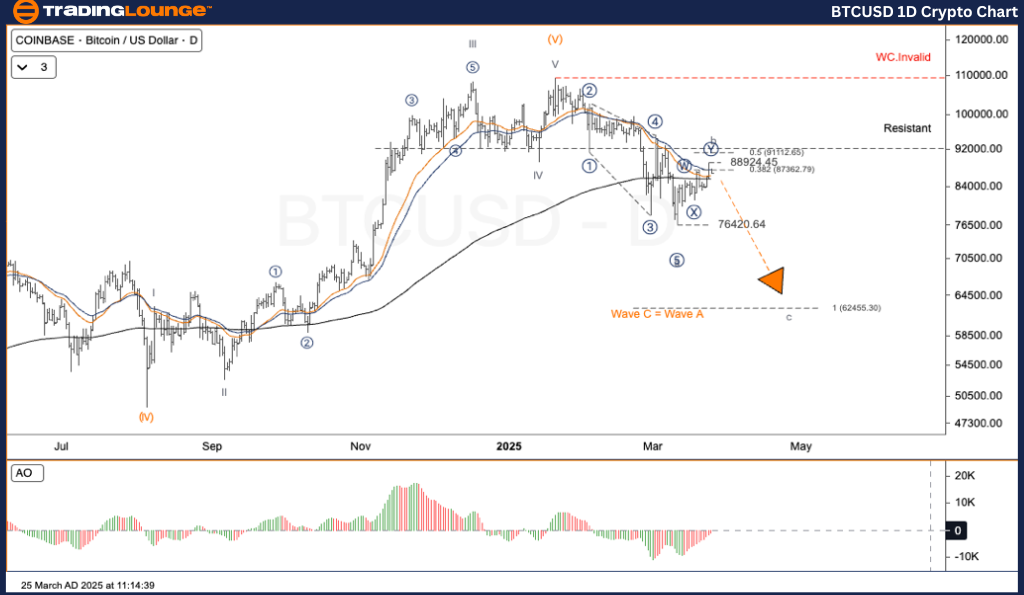
BTCUSD Elliott Wave Analysis | Bitcoin Price Forecast Daily Chart

Bitcoin/U.S. Dollar (BTCUSD) – Daily Chart Review

BTCUSD Elliott Wave Technical Outlook

Function: Counter-Trend Movement

Market Mode: Corrective Phase

Wave Structure: Zigzag Pattern

Current Position: Wave C Formation

Next Higher Degree Trend: Anticipating Wave ((II))

Invalidation Level: Not Defined

BTCUSD Forecast & Strategy – Bitcoin Price Analysis

Bitcoin has posted a brief recovery in recent days. However, from an Elliott Wave perspective, the upward momentum still fits into a corrective phase, structured as an a–b–c wave pattern. We anticipate the formation of wave c next, which may lead to a sharper decline in Bitcoin’s price than initially expected.

  • Completion of Wave (V) marks the beginning of a corrective A-B-C pattern.
  • Wave b appears to be forming a Double Zigzag pattern (W)-(X)-(Y). The market is nearing the completion of wave b, and downward pressure is expected as wave c begins.

Bitcoin Trading Strategy

For Short-Term Swing Traders:

  • Watch for bearish reversal signals in the $88K–$91K resistance area.
  • Once a reversal or bearish divergence confirms → Execute short positions.

Target Price Range: $68,000 to $62,000

Risk Management: A clear break above $112K invalidates the corrective setup → Indicates a potential bullish trend continuation.

BTCUSD-1D-Cryto-Char...


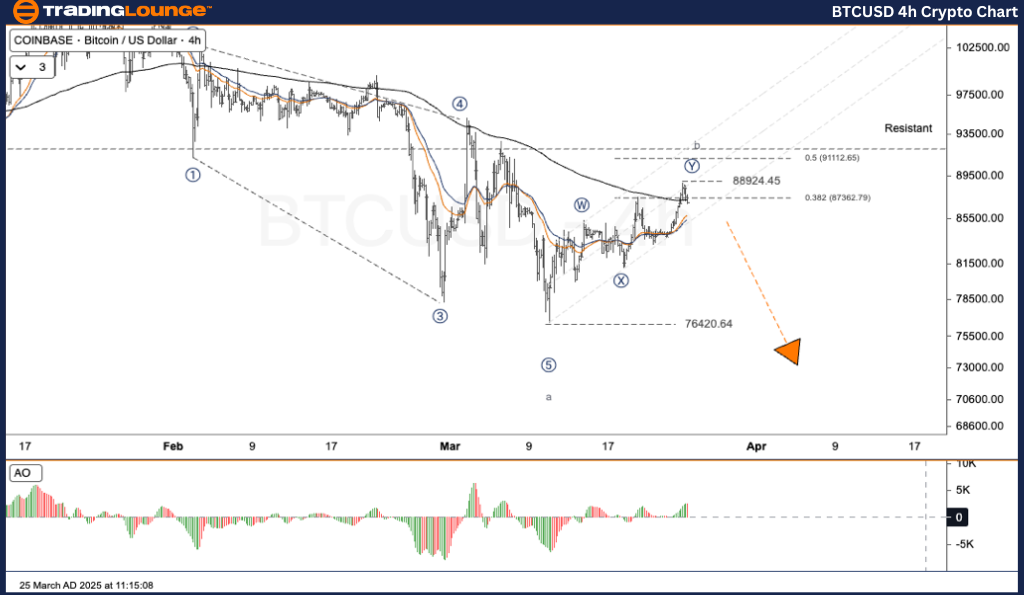
BTCUSD Elliott Wave Analysis | Bitcoin Price Forecast H4 Chart

Bitcoin/U.S. Dollar (BTCUSD) – 4-Hour Chart Review

BTCUSD Elliott Wave Technical Outlook

Function: Counter-Trend Setup

Market Mode: Corrective Movement

Wave Structure: Zigzag Formation

Current Position: In Progress of Wave C

Next Higher Degree Trend: Tracking Wave ((II))

Invalidation Level: Not Defined

Bitcoin Price Forecast & Strategy – Intraday View

While Bitcoin has seen upward movement recently, Elliott Wave indicators continue to interpret the structure as a corrective a–b–c sequence. The development of wave c may trigger deeper price declines.

  • Wave (V) is now complete, leading to an A-B-C corrective wave.
  • Wave b is evolving into a Double Zigzag pattern (W)-(X)-(Y), signaling that wave c may begin shortly.
  • Short-Term Trading Strategy

Swing Trade Tactics:

  • Focus on the $88K–$91K zone for reversal patterns or bearish divergences.
  • Upon confirmation of trend shift → Position for downside trades.
  • Bearish Target Range: $68,000 to $62,000

Risk Management: A decisive move above $112K disrupts the bearish structure → Indicates trend reversal to bullish bias.

Technical Analyst: Kittiampon Somboonsod

Source: Visit Tradinglounge.com and learn from the Experts. Join TradingLounge Here 

Previous: THETAUSD Elliott Wave Technical Analysis

VALUE Offer - Buy 1 Month & Get 3 Months!Click here

Access 7 Analysts Over 200 Markets Covered. Chat Room With Support

BTCUSD-4h-Cryto-Char...

Related

Tesla Inc.(TSLA:NASDAQ) Elliott Wave Technical Analysis 11 January 24

Tesla Inc.(TSLA:NASDAQ) Elliott Wave Technical Analysis 11 January 24

Tesla Inc.(TSLA:NASDAQ) Elliott Wave Technical Analysis 11 January 24 shows TSLA Stock Market Analys...

Read More >
Insights into ICICI Bank's Stock Performance and Future Price Movements: ICICIBANK Elliott Wave Technical Analysis

Insights into ICICI Bank's Stock Performance and Future Price Movements: ICICIBANK Elliott Wave Technical Analysis

This article provides a comprehensive Elliott Wave analysis of ICICI Bank's stock, detailing pot...

Read More >
Our Expert U.S. Dollar/Canadian Dollar Technical Analysis and Forecasts with USDCAD Forex Elliott Wave Technical Analysis

Our Expert U.S. Dollar/Canadian Dollar Technical Analysis and Forecasts with USDCAD Forex Elliott Wave Technical Analysis

Our detailed USDCAD Elliott Wave analysis provides insights into the current market trends, focusing...

Read More >
Technical Insights on Gold Commodity Trading and Potential Corrections: Gold (XAUUSD) Elliott Wave Technical Analysis

Technical Insights on Gold Commodity Trading and Potential Corrections: Gold (XAUUSD) Elliott Wave Technical Analysis

This analysis provides a comprehensive Elliott Wave forecast for Gold, highlighting key market trend...

Read More >
Cardano (ADAUSD) Elliott Wave Analysis: Price Forecast, Fibonacci Levels, Trading Strategy & Wave (III) Setup

Cardano (ADAUSD) Elliott Wave Analysis: Price Forecast, Fibonacci Levels, Trading Strategy & Wave (III) Setup

Elliott Wave technical analysis of Cardano (ADAUSD), including daily and 4-hour chart breakdowns. It...

Read More >

$1 for 2 Weeks

then $29 a month!

What a Special Offer!

Trade Recommendations

Unleash the power of deversified trading with our comprehensive portfolio, covering 250+ markets:

  • Stock Trades
  • Crypto Trades
  • Forex Trades
  • Commodity Trades
Elliott Wave Analysis

Gain a competitive edge with expert insights and AI-powered Elliott Wave charting into:

  • Global Indices
  • US Stocks & ASX Stocks
  • Forex & Crypto
  • Commodities
Top-Notch Trading Tools

Equip yourself with the tools of success:

  • Real-time Chat rooms
  • Elliott Wave Algorithm
  • Portfolio tools
  • TradingLevels
  • Screener
  • Trading Game
7 Elliott Wave Analysts

Stay ahead of the market with daily charts and insightful videos
Your secret to strategic trading!

JOIN HERE


Welcome to TradingLounge (ASIC A.R.No. 321187), specialists in trades, trading education and technical analysis, covering stocks, indices, commodities, forex and cryptocurrencies.

When you join TradingLounge you have access to everything we offer, including trade tools, educational content and a social platform to chat with like-minded investors.

Read more

@Copyright 2024 by tradinglounge.com

Contact Us

Australian no: 02 4787 6020

International no: +61 (2) 47876020

Pay with:

Find us on