13Jan

S&P 500 Elliott Wave Technical Analysis: Forecasts, Trading Strategies, and Market Trends for Successful Stock Trading

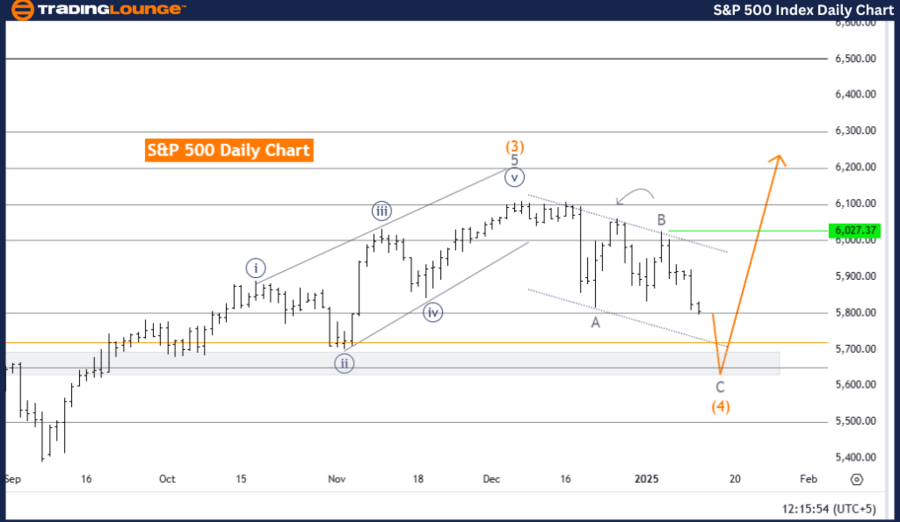
S&P 500 Elliott Wave Analysis – Trading Lounge Day Chart

S&P 500 Elliott Wave Technical Analysis

Function: Counter-Trend

Mode: Impulsive as Wave C

Structure: Gray Wave C

Position: Orange Wave 4

Next Higher Degree Direction: Orange Wave 5

Details:
The S&P 500 Index is currently in a counter-trend phase, as indicated by Elliott Wave Analysis on the daily chart. The market is displaying an impulsive behavior, represented by gray Wave C, which is a part of the larger corrective structure known as orange Wave 4. This development follows the completion of gray Wave B, signaling that gray Wave C is actively unfolding within orange Wave 4.

Gray Wave C represents the final impulsive wave of this correction phase, marking the completion of orange Wave 4. This stage is crucial as it sets the groundwork for the market's transition to orange Wave 5, which aligns with the broader bullish trend expected to follow.

Once orange Wave 4 and gray Wave C are finalized, the market will confirm the conclusion of the current corrective cycle, paving the way for the anticipated orange Wave 5. This upward wave is forecasted to continue the broader impulsive structure, reaffirming bullish momentum in the S&P 500 Index.

Summary:

  • The S&P 500 is in the midst of a counter-trend phase with gray Wave C unfolding within orange Wave 4.
  • This phase serves as the final stage of the ongoing correction, signaling preparation for the next upward move, orange Wave 5.
  • The development of gray Wave C provides essential insights into future price trends and confirms the broader bullish direction.

S&PTSX-60-index-dail...


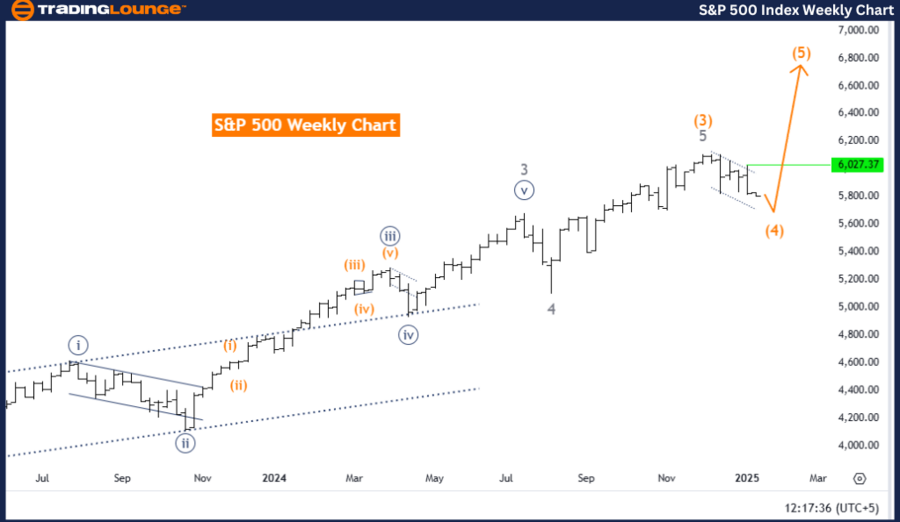
S&P 500 Elliott Wave Analysis – Trading Lounge Weekly Chart

S&P 500 Elliott Wave Technical Analysis

Function: Counter-Trend

Mode: Corrective

Structure: Likely Zigzag

Position: Orange Wave 4

Next Higher Degree Direction: Orange Wave 5

Details:
On the weekly chart, the S&P 500 Index is undergoing a counter-trend corrective phase, likely forming a zigzag pattern within orange Wave 4. This phase comes after the completion of orange Wave 3, acting as a temporary retracement in the broader bullish trajectory.

The orange Wave 4 correction features a well-defined three-part structure, characteristic of a zigzag formation. This wave serves as a necessary consolidation phase before the market transitions into orange Wave 5, resuming the upward momentum consistent with the higher-degree bullish trend.

The conclusion of orange Wave 3 underscores the market's readiness for a corrective pullback, with orange Wave 4 providing a structured pause in the broader impulsive cycle. This stage allows the market to consolidate and realign before advancing into the final bullish phase.

Summary:

  • The S&P 500 Index is in a corrective orange Wave 4 on the weekly chart, likely forming a zigzag pattern.
  • This phase follows the completion of orange Wave 3 and prepares the market for the next upward leg, orange Wave 5.
  • The completion of orange Wave 4 will maintain the structural integrity of the Elliott Wave pattern, offering critical insights into future trends and the overall bullish direction.

Technical Analyst: Malik Awais

Source: visit Tradinglounge.com and learn From the Experts Join TradingLounge Here 

Previous: S&P/TSX 60 Elliott Wave Technical Analysis

VALUE Offer - Buy 1 Month & Get 3 Months!Click here

Access 7 Analysts Over 200 Markets Covered. Chat Room With Support

S&PTSX-60-index-week...

Related

USDCAD Elliott Wave Forecast Reveals Bearish Trend with Key Impulse structures guiding the outlook and Trading Insights

USDCAD Elliott Wave Forecast Reveals Bearish Trend with Key Impulse structures guiding the outlook and Trading Insights

This analysis of the USDCAD using Elliott Wave theory forecasts a continued bearish trend with impul...

Read More >
New Zealand Dollar/U.S.Dollar (NZDUSD) Forex Elliott Wave Technical Analysis: Comprehensive Market Forecast

New Zealand Dollar/U.S.Dollar (NZDUSD) Forex Elliott Wave Technical Analysis: Comprehensive Market Forecast

This article provides an in-depth Elliott Wave Analysis of the NZDUSD pair on both the daily and 4-h...

Read More >
Apple Inc. (AAPL) Stocks Elliott Wave Technical Analysis: Forecast and Insights

Apple Inc. (AAPL) Stocks Elliott Wave Technical Analysis: Forecast and Insights

Explore our detailed analysis of Apple Inc. (AAPL) using Elliott Wave Theory. Understand the current...

Read More >
VeChain (VETUSD) Elliott Wave Analysis: Identifying Profitable Trends and Trading Strategies

VeChain (VETUSD) Elliott Wave Analysis: Identifying Profitable Trends and Trading Strategies

VeChain (VETUSD) trading opportunities with Elliott Wave analysis provided by TradingLounge. Explore...

Read More >
Costco Wholesale Corp.(COST) Stocks Elliott Wave Technical Analysis: Focusing on both daily and 4-hour charts

Costco Wholesale Corp.(COST) Stocks Elliott Wave Technical Analysis: Focusing on both daily and 4-hour charts

This article provides a detailed Elliott Wave analysis of Costco Wholesale Corp. (COST) focusing on ...

Read More >
Our Detailed Elliott Wave Technical Analysis of ASX: SCG Offers Insights into Scentre Group's Stock Movements

Our Detailed Elliott Wave Technical Analysis of ASX: SCG Offers Insights into Scentre Group's Stock Movements

Our detailed Elliott Wave analysis of ASX: SCG offers insights into Scentre Group's stock moveme...

Read More >

$1 for 2 Weeks

then $29 a month!

What a Special Offer!

Trade Recommendations

Unleash the power of deversified trading with our comprehensive portfolio, covering 250+ markets:

  • Stock Trades
  • Crypto Trades
  • Forex Trades
  • Commodity Trades
Elliott Wave Analysis

Gain a competitive edge with expert insights and AI-powered Elliott Wave charting into:

  • Global Indices
  • US Stocks & ASX Stocks
  • Forex & Crypto
  • Commodities
Top-Notch Trading Tools

Equip yourself with the tools of success:

  • Real-time Chat rooms
  • Elliott Wave Algorithm
  • Portfolio tools
  • TradingLevels
  • Screener
  • Trading Game
7 Elliott Wave Analysts

Stay ahead of the market with daily charts and insightful videos
Your secret to strategic trading!

JOIN HERE


Welcome to TradingLounge (ASIC A.R.No. 321187), specialists in trades, trading education and technical analysis, covering stocks, indices, commodities, forex and cryptocurrencies.

When you join TradingLounge you have access to everything we offer, including trade tools, educational content and a social platform to chat with like-minded investors.

Read more

@Copyright 2024 by tradinglounge.com

Contact Us

Australian no: 02 4787 6020

International no: +61 (2) 47876020

Pay with:

Find us on