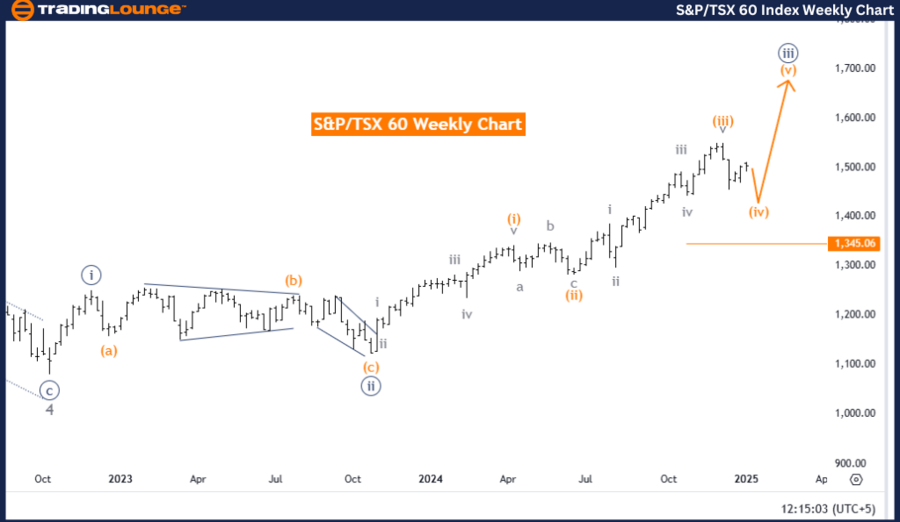
S&P/TSX 60 Elliott Wave Analysis - Daily Chart
Function: Counter Trend
Mode: Corrective
Structure: Orange Wave 4
Position: Navy Blue Wave 3
Direction Next Higher Degrees: Orange Wave 5
Details: Orange wave three appears complete, and orange wave four is currently active.
Wave Cancel Invalid Level: 1,345.06
The S&P/TSX 60 Index is in a counter-trend corrective phase, as indicated by Elliott Wave Analysis on the daily chart. This phase corresponds to orange wave four, a component of the broader navy blue wave three structure. With orange wave three likely completed, the market is now transitioning into orange wave four.
Key Insights
1. Orange Wave 4 as a Corrective Phase:
- Orange wave four marks a retracement within the prevailing bullish trend.
- This phase aligns with Elliott Wave Theory, occurring after the impulsive movement of orange wave three.
2. Transition to Orange Wave 5:
- Following the completion of orange wave four, the market is anticipated to move into orange wave five.
- Orange wave five is expected to resume the upward momentum, continuing the overall bullish trajectory.
3. Invalidation Level:
- The 1,345.06 level serves as the invalidation benchmark.
- A price drop below this level invalidates the current wave count, necessitating a reevaluation of the Elliott Wave framework.
Conclusion
The S&P/TSX 60 Index is navigating a corrective phase identified as orange wave four, part of the broader navy blue wave three. This pullback phase sets the stage for the market's next upward leg, expected in orange wave five. Monitoring the 1,345.06 invalidation level is essential for confirming the validity of the current wave structure. As orange wave four evolves, it solidifies the foundation for continued bullish momentum under Elliott Wave Theory.
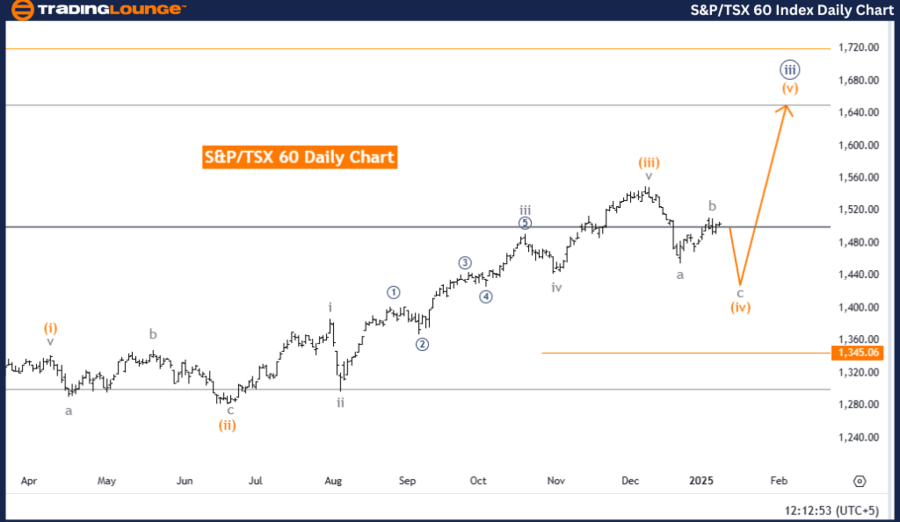
S&P/TSX 60 Elliott Wave Analysis - Weekly Chart
S&P/TSX 60 Elliott Wave Technical Analysis
Function: Counter Trend
Mode: Corrective
Structure: Orange Wave 4
Position: Navy Blue Wave 3
Direction Next Higher Degrees: Orange Wave 5
Details: Orange wave three appears completed, and orange wave four is currently underway.
Wave Cancel Invalid Level: 1,345.06
On the weekly chart, the S&P/TSX 60 Index shows a counter-trend corrective phase, identified as orange wave four, which is part of the larger navy blue wave three structure. The completion of orange wave three has set the stage for the ongoing development of orange wave four.
Key Insights
1. Orange Wave 4 as a Corrective Move:
- Orange wave four signifies a standard corrective phase within the bullish framework.
- This phase occurs as a natural alternation after the impulsive strength of orange wave three.
2. Transition to Orange Wave 5:
- Upon orange wave four's conclusion, the market is forecasted to progress into orange wave five.
- This transition will likely resume the upward trajectory, further advancing the broader bullish trend.
3. Invalidation Level:
- The 1,345.06 level is crucial for invalidation.
- Should the price dip below this benchmark, the current wave analysis will require reconfiguration.
Conclusion
The S&P/TSX 60 Index is currently in a corrective phase marked by orange wave four, within the context of navy blue wave three. This temporary retracement phase is an integral part of Elliott Wave Theory, preparing the market for the upcoming impulsive move in orange wave five.
The 1,345.06 invalidation level is a key reference point for maintaining the accuracy of the analysis. As orange wave four progresses, it continues to play a vital role in the Elliott Wave sequence, setting the stage for sustained bullish momentum in subsequent phases.
Technical Analyst: Malik Awais
Source: visit Tradinglounge.com and learn From the Experts Join TradingLounge Here
Previous: Swiss Market Elliott Wave Technical Analysis
VALUE Offer - Buy 1 Month & Get 3 Months!Click here
Access 7 Analysts Over 200 Markets Covered. Chat Room With Support