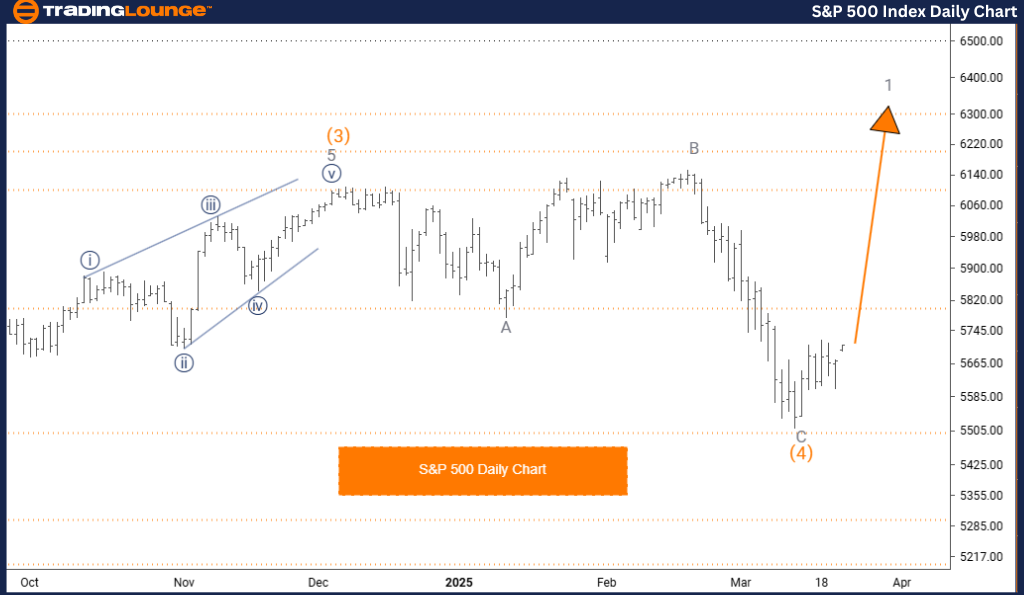
S&P 500 Elliott Wave Analysis – TradingLounge Daily Chart
S&P 500 Elliott Wave Technical Analysis
FUNCTION: Trend
MODE: Impulsive
STRUCTURE: Gray Wave 1
POSITION: Orange Wave 5
DIRECTION NEXT HIGHER DEGREES: Gray Wave 1 (Started)
DETAILS: Orange Wave 4 appears complete; Gray Wave 1 of 5 is now active.
The Elliott Wave analysis for the S&P 500 daily chart provides essential insights into the index's current market behavior and short-term direction. The index is exhibiting a strong bullish trend, driven by impulsive wave formations rather than corrective patterns.
The analysis currently centers around Gray Wave 1, developing within the broader Orange Wave 5 structure. This wave count highlights the index’s positioning in the ongoing cycle. Based on recent market movement, Orange Wave 4 has likely concluded, and Gray Wave 1 of 5 is now active and progressing.
This active wave phase is expected to maintain upward momentum, indicating continued bullish potential. The next significant wave to monitor is Gray Wave 1, which is already underway. S&P 500 traders should observe this structure carefully to plan for potential trend continuation. Gaining clarity on wave structure helps improve the accuracy of price trend forecasting.
This daily Elliott Wave overview equips traders with a broader market perspective, aligning trading decisions with medium-term movements. Recognizing key wave transitions enables timely market entries and exits. By focusing on wave dynamics, traders can adapt to evolving market conditions effectively.
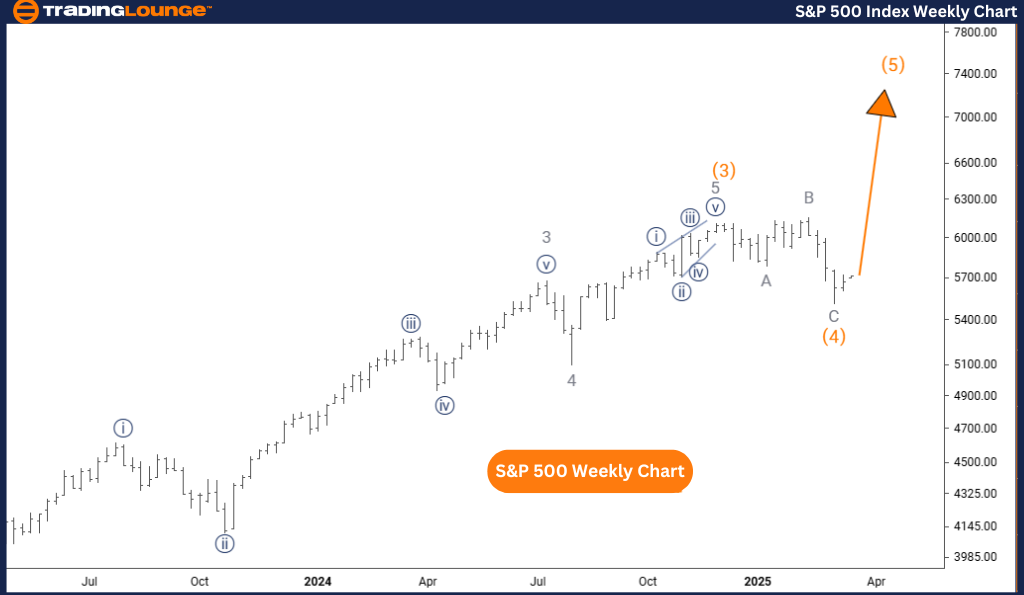
S&P 500Elliott Wave Analysis – TradingLounge Weekly Chart
S&P 500 Elliott Wave Technical Analysis
FUNCTION: Trend
MODE: Impulsive
STRUCTURE: Orange Wave 5
POSITION: Navy Blue Wave 1
DIRECTION NEXT HIGHER DEGREES: Orange Wave 5 (Started)
DETAILS: Orange Wave 4 appears complete; Orange Wave 5 is now active.
The weekly Elliott Wave forecast for the S&P 500 offers a comprehensive look into the long-term market structure. The index is currently trending, with its movement driven by impulsive wave activity suggesting a bullish market environment.
This analysis focuses on the development of Orange Wave 5 within the larger Navy Blue Wave 1, confirming its broader cycle position. Current indications show that Orange Wave 4 has ended, and Orange Wave 5 has begun its advance.
This wave is projected to sustain its impulsive nature, signaling further upward price action before any major correction emerges. The active wave to track remains Orange Wave 5, now in motion. Traders are advised to follow this structure closely to anticipate the continuation of the trend. Understanding the Elliott Wave count is key to enhancing market prediction accuracy.
This long-term analysis using the weekly chart helps traders align with dominant trends, assess market cycles, and improve entry/exit strategies. Recognizing wave completions and the initiation of new waves supports better risk management and trading confidence.
Technical Analyst: Malik Awais
Source: visit Tradinglounge.com and learn From the Experts Join TradingLounge Here
Previous:DR REDDY LABORATORIES Elliott Wave Technical Analysis
VALUE Offer - Buy 1 Month & Get 3 Months!Click here
Access 7 Analysts Over 200 Markets Covered. Chat Room With Support