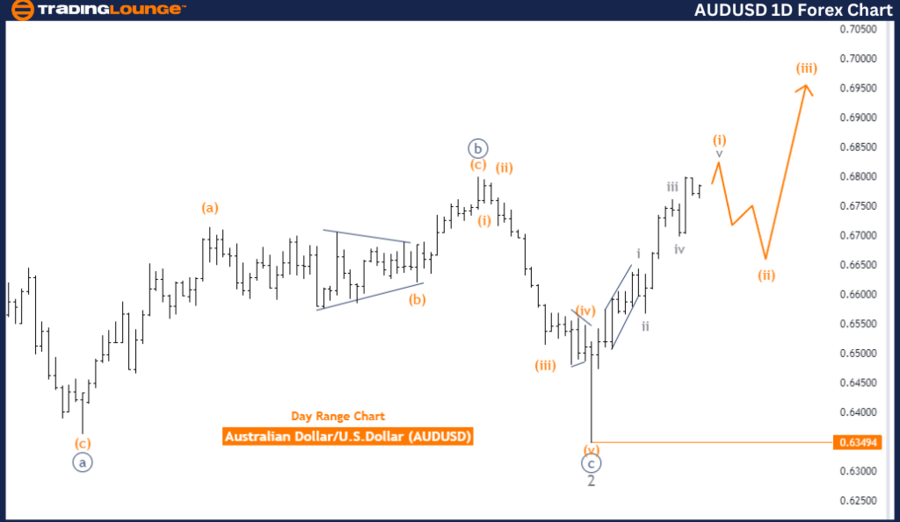
AUDUSD Elliott Wave Analysis - Trading Lounge Day Chart

Australian Dollar/U.S. Dollar (AUDUSD) Day Chart Analysis

AUDUSD Elliott Wave Technical Analysis

  • Function: Bullish Trend

  • Mode: Impulsive

  • Structure: Orange Wave 1

  • Position: Navy Blue Wave 1

  • Direction Next Lower Degrees: Orange Wave 2

  • Details: Orange Wave 1 remains active and is nearing completion.

  • Wave Cancel Invalid Level: 0.63494

The AUDUSD is currently showing a strong bullish trend according to Elliott Wave analysis on the daily chart. The market is operating in an impulsive mode, indicating a persistent upward momentum. The primary structure under analysis is the orange wave 1, which represents the beginning of this upward movement. This wave is still active and approaching its completion, signaling that the ongoing bullish trend is still evolving, though a corrective phase may soon follow.

The current market position is identified as navy blue wave 1 within the broader orange wave 1 structure. This suggests that the overall upward trend is in its early stages, leaving room for further gains before a significant pullback might occur. The analysis anticipates that after the completion of the current wave, a corrective phase, marked as orange wave 2, could ensue. This correction is expected to be a temporary retracement within the broader bullish trend, paving the way for the next phase of upward movement.

A crucial level to watch is 0.63494, known as the wave cancel invalid level. If the price dips below this level, the current wave structure would be invalidated, potentially signaling a shift in market direction or even a possible trend reversal. This level is essential for traders, as it helps determine whether the bullish trend remains intact or if market dynamics are changing.

In summary, the AUDUSD is in a bullish impulsive trend on the daily chart, with the market positioned in navy blue wave 1 of orange wave 1. The trend is upward, but the completion of orange wave 1 is imminent, and traders should closely monitor the 0.63494 level. A breach of this level could invalidate the current wave structure and suggest a potential trend reversal.

AUDUSD-1D-Forex-Char...


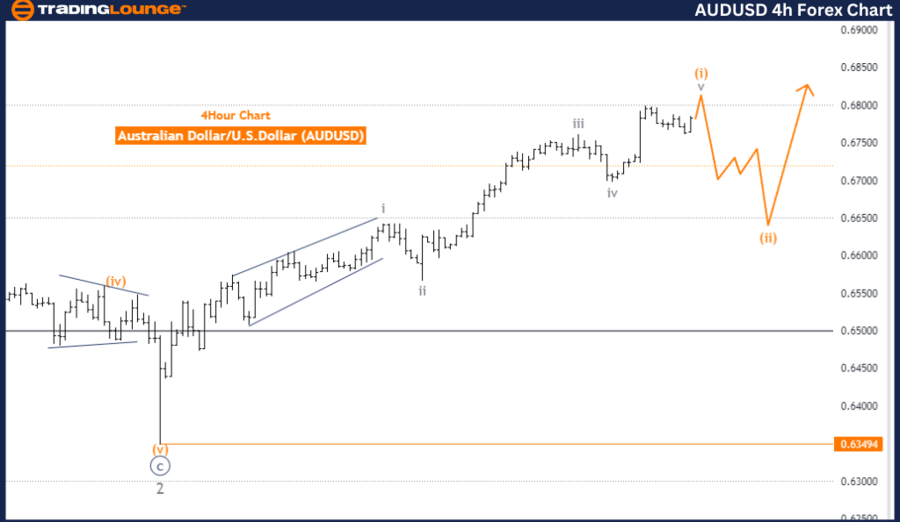
AUDUSD Elliott Wave Analysis - Trading Lounge 4-Hour Chart

Australian Dollar/U.S. Dollar (AUDUSD) 4-Hour Chart Analysis

AUDUSD Elliott Wave Technical Analysis

  • Function: Bullish Trend

  • Mode: Impulsive

  • Structure: Orange Wave 1

  • Position: Navy Blue Wave 1

  • Direction Next Lower Degrees: Orange Wave 2

  • Details: Orange Wave 1 remains active and is nearing completion.

  • Wave Cancel Invalid Level: 0.63494

The AUDUSD is currently in a bullish trend according to the Elliott Wave analysis on the 4-hour chart. The market is following an impulsive mode, indicating a strong and ongoing upward movement. The primary structure observed is orange wave 1, which shows that the initial phase of this upward trend is still progressing.

The market is positioned in navy blue wave 1, part of the larger orange wave 1 structure. This indicates that the broader upward trend is in its early stages, with further gains anticipated before any significant correction or pullback occurs. Since orange wave 1 remains active, it suggests that the current upward movement is nearing its completion.

The direction of the next lower degrees points to orange wave 2, implying that after the current wave completes, a corrective phase might follow. This correction would represent a temporary pullback within the broader bullish trend, likely setting the stage for further upward movement in subsequent waves.

The key level to watch is 0.63494, identified as the wave cancel invalid level. If the market falls below this level, it would invalidate the current wave structure, signaling a potential shift in the market's direction or a possible trend reversal. This level serves as a critical benchmark for traders to confirm the ongoing bullish trend.

In summary, the AUDUSD is currently in a bullish impulsive trend on the 4-hour chart, with the market positioned in navy blue wave 1 of orange wave 1. The trend remains upward, but traders should closely watch the 0.63494 level, as a drop below this point would invalidate the current wave structure and could indicate a trend reversal.

Technical Analyst: Malik Awais

Source: visit Tradinglounge.com and learn From the Experts Join TradingLounge Here 

Previous: Euro/British Pound (EUR/GBP) Elliott Wave Technical Analysis

Special Trial Offer - 0.76 Cents a Day for 3 Months! Click here

Access 7 Analysts Over 200 Markets Covered. Chat Room With Support

AUDUSD-4H-Forex-Char...

Related

U.S. Dollar / Japanese Yen (USDJPY) Elliott Wave Analysis: Daily and 4-Hour Chart Forecasts, Bullish Trends and Forex Trading

U.S. Dollar / Japanese Yen (USDJPY) Elliott Wave Analysis: Daily and 4-Hour Chart Forecasts, Bullish Trends and Forex Trading

USDJPY Elliott Wave analysis, covering both daily and 4-hour charts. Learn about the current bullish...

Read More >
Silver XAGUSD Commodity Elliott Wave Technical Analysis: Support Levels and Future Price Movements

Silver XAGUSD Commodity Elliott Wave Technical Analysis: Support Levels and Future Price Movements

This comprehensive analysis of Silver includes detailed Elliott Wave Analysis, price predictions, an...

Read More >
Unlocking ASX Trading Success: TELSTRA GROUP LIMITED - TLS Stock Analysis & Elliott Wave Technical Forecast

Unlocking ASX Trading Success: TELSTRA GROUP LIMITED - TLS Stock Analysis & Elliott Wave Technical Forecast

Dive into the latest Telstra Group Limited (TLS.ASX) analysis with Elliott Wave insights. Learn abou...

Read More >
Insights and Key Levels for USDCHF Currency Pair: U.S.Dollar/Swiss Franc(USD/CHF) Elliott Wave Technical Analysis

Insights and Key Levels for USDCHF Currency Pair: U.S.Dollar/Swiss Franc(USD/CHF) Elliott Wave Technical Analysis

Discover in-depth USD/CHF Elliott Wave analysis providing technical forecasts and trading strategies...

Read More >
Copper Commodity-Elliott Wave Analysis: Highlights Recent Price Movements, Long-term Trends, and Key Chart Patterns

Copper Commodity-Elliott Wave Analysis: Highlights Recent Price Movements, Long-term Trends, and Key Chart Patterns

This comprehensive Copper Elliott Wave analysis highlights recent price movements, long-term trends,...

Read More >
NEE Elliott Wave Analysis: Explore NextEra Energy Stock Trends, Flat Structures, and Bullish Reversal Forecasts

NEE Elliott Wave Analysis: Explore NextEra Energy Stock Trends, Flat Structures, and Bullish Reversal Forecasts

Elliott Wave analysis of NextEra Energy (NEE) examines current stock trends, focusing on wave C corr...

Read More >
U.S. Dollar / Japanese Yen (USDJPY) Elliott Wave Analysis: Daily and 4-Hour Chart Forecasts, Bullish Trends and Forex Trading

U.S. Dollar / Japanese Yen (USDJPY) Elliott Wave Analysis: Daily and 4-Hour Chart Forecasts, Bullish Trends and Forex Trading

USDJPY Elliott Wave analysis, covering both daily and 4-hour charts. Learn about the current bullish...

Read More >
Silver XAGUSD Commodity Elliott Wave Technical Analysis: Support Levels and Future Price Movements

Silver XAGUSD Commodity Elliott Wave Technical Analysis: Support Levels and Future Price Movements

This comprehensive analysis of Silver includes detailed Elliott Wave Analysis, price predictions, an...

Read More >
Unlocking ASX Trading Success: TELSTRA GROUP LIMITED - TLS Stock Analysis & Elliott Wave Technical Forecast

Unlocking ASX Trading Success: TELSTRA GROUP LIMITED - TLS Stock Analysis & Elliott Wave Technical Forecast

Dive into the latest Telstra Group Limited (TLS.ASX) analysis with Elliott Wave insights. Learn abou...

Read More >
Insights and Key Levels for USDCHF Currency Pair: U.S.Dollar/Swiss Franc(USD/CHF) Elliott Wave Technical Analysis

Insights and Key Levels for USDCHF Currency Pair: U.S.Dollar/Swiss Franc(USD/CHF) Elliott Wave Technical Analysis

Discover in-depth USD/CHF Elliott Wave analysis providing technical forecasts and trading strategies...

Read More >
Copper Commodity-Elliott Wave Analysis: Highlights Recent Price Movements, Long-term Trends, and Key Chart Patterns

Copper Commodity-Elliott Wave Analysis: Highlights Recent Price Movements, Long-term Trends, and Key Chart Patterns

This comprehensive Copper Elliott Wave analysis highlights recent price movements, long-term trends,...

Read More >
NEE Elliott Wave Analysis: Explore NextEra Energy Stock Trends, Flat Structures, and Bullish Reversal Forecasts

NEE Elliott Wave Analysis: Explore NextEra Energy Stock Trends, Flat Structures, and Bullish Reversal Forecasts

Elliott Wave analysis of NextEra Energy (NEE) examines current stock trends, focusing on wave C corr...

Read More >

Buy 1 Month

Get 3 Months!

Special Offer:

Trade Recommendations

Unleash the power of deversified trading with our comprehensive portfolio, covering:

  • Stock Trades
  • Crypto Trades
  • Forex Trades
  • Commodity Trades
Elliott Wave Analysis

Gain a competive edge with expert insights in to:

  • Global Indices
  • US Stocks & ASX Stocks
  • Forex & Crypto
  • Commodities
Top-Notch Trading Tools

Equip yourself with the tools of success:

  • Social Chat
  • Elliott Wave Algorithm
  • Screener
  • TradingLevels
  • Trading Game
7 Elliott Wave Analysts

Stay ahead of the market with daily charts and insightful videos
-Your secret to strategic trading!

JOIN HERE


Welcome to TradingLounge (ASIC A.R.No. 321187), specialists in trades, trading education and technical analysis, covering stocks, indices, commodities, forex and cryptocurrencies.

When you join TradingLounge you have access to everything we offer, including trade tools, educational content and a social platform to chat with like-minded investors.

Read more

@Copyright 2024 by tradinglounge.com

Contact Us

Australian no: 02 4787 6020

International no: +61 (2) 47876020

Pay with:

Find us on