30Apr

Gold XAUUSD Elliott Wave Price Forecast: Wave 2 Pullback Offers Bullish Setup, Wave 3 Could Target 3700 and Beyond

Gold Market Overview – Elliott Wave Analysis

Gold continues to trade within a strong long-term Elliott Wave bullish cycle, with each major pullback over the past 2–3 years offering fresh long entry opportunities. The current correction from April 2025’s high is expected to follow this same pattern, potentially setting up for another impulsive move higher.


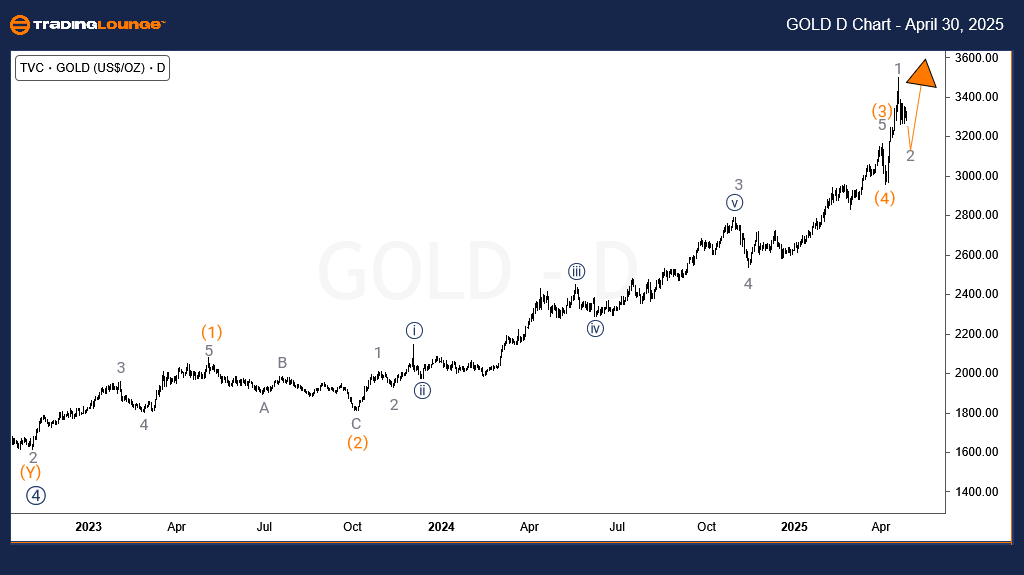
Gold Elliott Wave Analysis - Daily Chart

Wave ((4)) of cycle degree concluded in October 2022, setting the stage for the current bullish advance in wave ((5)).

Wave ((5)) represents the final leg of wave I of (III), the broader Elliott Wave uptrend that began in December 2015.

Within wave ((5)):

  • Wave (3) peaked on April 2
  • Wave (4) completed on April 7
  • Wave (5) initiated from the April 7 low, completing wave 1 of (5) with a clean impulsive structure

The current pullback is wave 2 of (5). As long as price action stays above the key invalidation level at 2956, the bullish outlook remains valid.

XAUUSD-d-chart-30042...


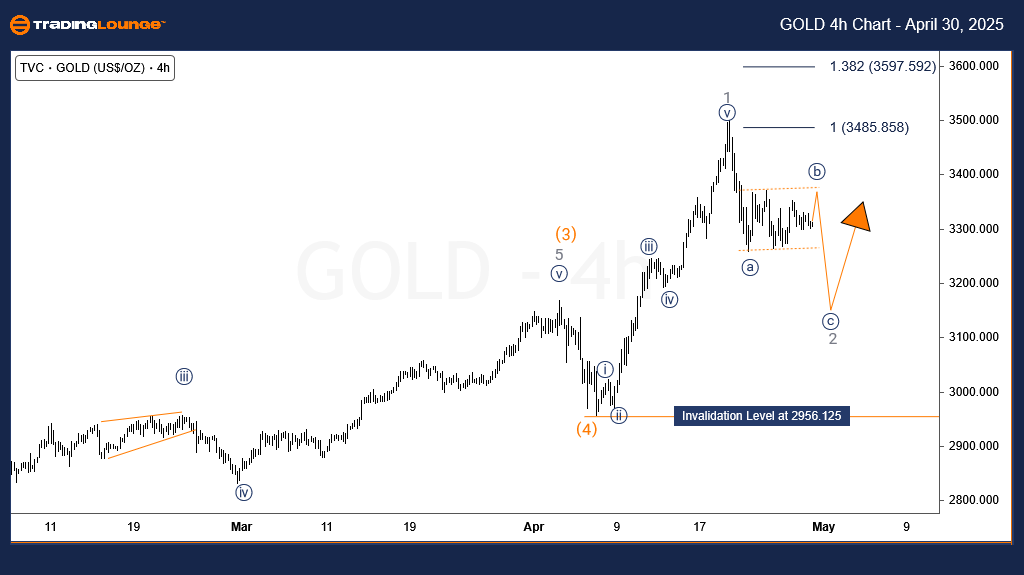
Gold Elliott Wave Analysis – 4-Hour Chart 

On the 4-hour chart, a clear sideways consolidation has followed a 5-wave decline from the recent high, indicating wave 2 is developing.

A break below the April 7 low may see wave 2 extend deeper into the 3127–3034 Fibonacci retracement zone — a potential buying area.

A firm rebound from this zone would suggest wave 3 of (5) is underway, with bullish targets projected towards 3700 and higher.

Technical Analyst: Sanmi Adeagbo

Source: Visit Tradinglounge.com and learn from the Experts Join TradingLounge Here 

See Previous: Cocoa Elliott Wave Technical Analysis

VALUE Offer - Buy 1 Month & Get 3 Months!Click here

Access 7 Analysts Over 200 Markets Covered. Chat Room With Support

XAUUSD-4h-chart-3004...


Conclusion – Gold Elliott Wave Outlook

Gold’s ongoing correction aligns with a larger bullish Elliott Wave structure. If wave 2 completes above key support, traders can anticipate the start of wave 3 of (5), opening up potential for significant upside and new multi-year highs.

Related

DJI Elliott Wave Technical Analysis: Dow Jones Index Market Analysis signals a bullish trend, with Wave Driving Upward Momentum

DJI Elliott Wave Technical Analysis: Dow Jones Index Market Analysis signals a bullish trend, with Wave Driving Upward Momentum

The Dow Jones Elliott Wave analysis signals a bullish trend, with Orange Wave 3 and Navy Blue Wave 5...

Read More >
Euro/ U.S. Dollar (EURUSD) Elliott Wave Analysis: Market Trends, and Trading Strategy for Forex Traders Using Elliott Wave Theory

Euro/ U.S. Dollar (EURUSD) Elliott Wave Analysis: Market Trends, and Trading Strategy for Forex Traders Using Elliott Wave Theory

EURUSD Elliott Wave Analysis provides a detailed forecast of the Euro/USD currency pair, highlightin...

Read More >
S&P BSE SENSEX NEXT 50 Elliott Wave Analysis Reveals Bullish Wave 3 Setup After Wave 2 Correction – Indian Stock Market Outlook

S&P BSE SENSEX NEXT 50 Elliott Wave Analysis Reveals Bullish Wave 3 Setup After Wave 2 Correction – Indian Stock Market Outlook

SENSEX NEXT 50 is forming a bullish Elliott Wave setup with wave 2 correction and a strong wave 3 ra...

Read More >
TCS Stock Elliott Wave Analysis Shows Bullish Impulse with Wave 1 Rising – Forecasting Higher Share Price and Trend Continuation

TCS Stock Elliott Wave Analysis Shows Bullish Impulse with Wave 1 Rising – Forecasting Higher Share Price and Trend Continuation

Detailed Elliott Wave analysis of TCS stock reveals a bullish impulsive structure on both daily and ...

Read More >
NEO (NEOUSD) Crypto Price News Today Elliott Wave Technical Analysis: Triangle Wave C Analysis with Swing-Trade Setup

NEO (NEOUSD) Crypto Price News Today Elliott Wave Technical Analysis: Triangle Wave C Analysis with Swing-Trade Setup

An Elliott Wave breakdown of NEO/USD daily and 4-hour charts reveals a developing triangle pattern i...

Read More >
JNJ Elliott Wave Technical Analysis: An In-depth Look at Johnson & Johnson's Market Movements

JNJ Elliott Wave Technical Analysis: An In-depth Look at Johnson & Johnson's Market Movements

This article provides an in-depth analysis of Johnson & Johnson (JNJ) stock, covering everything fro...

Read More >

$1 for 2 Weeks

then $29 a month!

What a Special Offer!

Trade Recommendations

Unleash the power of deversified trading with our comprehensive portfolio, covering 250+ markets:

  • Stock Trades
  • Crypto Trades
  • Forex Trades
  • Commodity Trades
Elliott Wave Analysis

Gain a competitive edge with expert insights and AI-powered Elliott Wave charting into:

  • Global Indices
  • US Stocks & ASX Stocks
  • Forex & Crypto
  • Commodities
Top-Notch Trading Tools

Equip yourself with the tools of success:

  • Real-time Chat rooms
  • Elliott Wave Algorithm
  • Portfolio tools
  • TradingLevels
  • Screener
  • Trading Game
7 Elliott Wave Analysts

Stay ahead of the market with daily charts and insightful videos
Your secret to strategic trading!

JOIN HERE


Welcome to TradingLounge (ASIC A.R.No. 321187), specialists in trades, trading education and technical analysis, covering stocks, indices, commodities, forex and cryptocurrencies.

When you join TradingLounge you have access to everything we offer, including trade tools, educational content and a social platform to chat with like-minded investors.

Read more

@Copyright 2024 by tradinglounge.com

Contact Us

Australian no: 02 4787 6020

International no: +61 (2) 47876020

Pay with:

Find us on