19May

Asian Paints Elliott Wave Analysis Reveals Bullish Trend Initiation with Critical Support and Potential Upward Price Movement

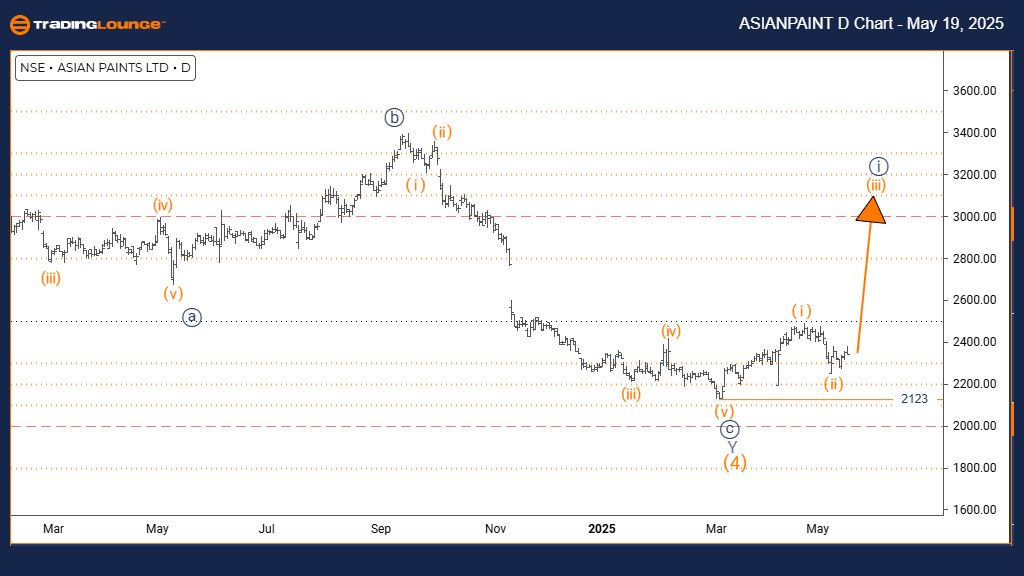
ASIAN PAINT Elliott Wave Analysis – Trading Lounge Day Chart

ASIAN PAINT Stock Day Chart Analysis

ASIAN PAINT Elliott Wave Technical Analysis

FUNCTION: Trend

MODE: Impulsive

STRUCTURE: Orange Wave 1

POSITION: Navy Blue Wave 1

DIRECTION NEXT LOWER DEGREES: Orange Wave 2

DETAILS: Orange Wave 1 of 1 is unfolding, signaling the initiation of a new bullish trend. Wave invalidation level: 2123

The daily Elliott Wave analysis for Asian Paints highlights the emergence of a new upward trend, backed by a clear impulsive wave structure. Current technical indicators confirm the formation of Orange Wave 1 nested within Navy Blue Wave 1, pointing to the early stages of a bullish move in the stock price.

Presently, Asian Paints is developing Orange Wave 1 under a larger Navy Blue Wave 1, suggesting the market is entering a new impulse phase. The pattern signals strong buying momentum, indicating continued upside potential. The 2123 support level acts as the critical invalidation point. A break below it could negate the current wave structure and imply a reevaluation is necessary.

This wave setup provides essential insight into the stock’s position in an early bullish cycle. If the impulsive structure remains intact, Orange Wave 2—a corrective pullback—is likely to follow, providing strategic opportunities for market participants.

Traders are advised to monitor the stock's price movements closely to confirm the impulsive progression. Protecting the 2123 invalidation level is crucial. Sustained momentum above this point may validate the trend, offering possible trading advantages while maintaining technical caution.

ASIANPAINT-indian-St...


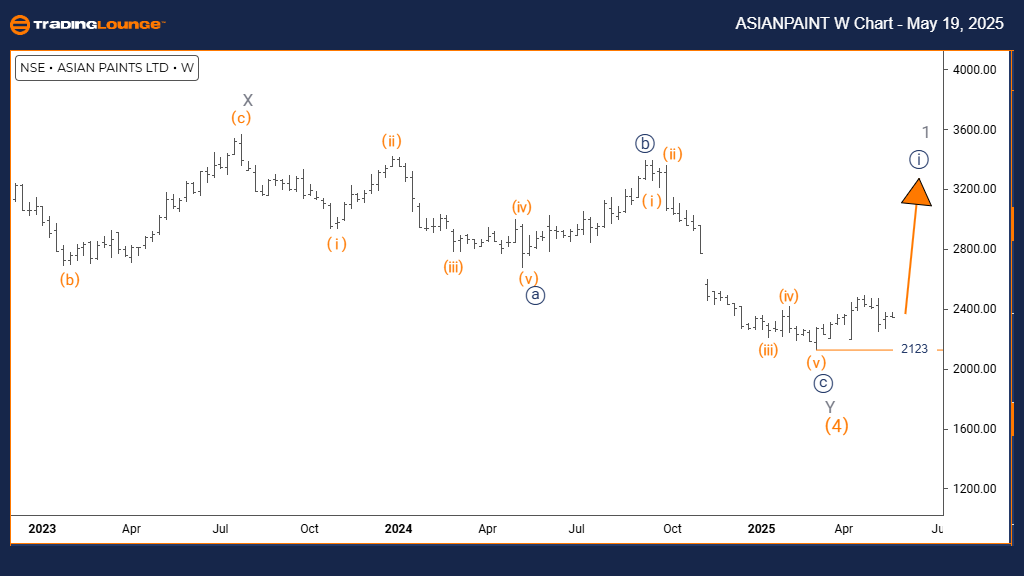
ASIAN PAINT Elliott Wave Analysis – Trading Lounge Weekly Chart

ASIAN PAINT Elliott Wave Technical Analysis

FUNCTION: Bullish Trend

MODE: Impulsive

STRUCTURE: Navy Blue Wave 1

POSITION: Gray Wave 1

DIRECTION NEXT LOWER DEGREES: Navy Blue Wave 2

DETAILS: Orange Wave 4 appears finalized; Navy Blue Wave 1 of 1 is developing. Wave invalidation level: 2123

The weekly Elliott Wave analysis for Asian Paints supports a bullish trend continuation, driven by the development of Navy Blue Wave 1 inside the broader Gray Wave 1 structure. The likely completion of Orange Wave 4 strengthens the outlook for the current upward momentum.

This transition into Navy Blue Wave 1 marks the beginning of a renewed impulsive phase. The pattern exhibits significant strength, with the 2123 invalidation level acting as key technical support. A breach below this level would challenge the existing wave count and could suggest a structural reassessment.

Within this framework, Asian Paints appears positioned at the early stage of a larger trend, offering potential for extended gains. Upon completion of this impulsive movement, Navy Blue Wave 2, a corrective phase, is projected to follow.

Market participants should track price behavior to confirm the impulsive character of Navy Blue Wave 1. Holding above the 2123 support zone is critical for maintaining the bullish wave outlook. Overall, the weekly chart supports continued upward strength, providing insights into the broader Elliott Wave roadmap for Asian Paints.

Technical Analyst: Malik Awais

Source: Visit Tradinglounge.com and learn from the Experts. Join TradingLounge Here 

Previous: NIFTY 50 INDEX Elliott Wave Technical Analysis

VALUE Offer - Buy 1 Month & Get 3 Months!Click here

Access 7 Analysts Over 200 Markets Covered. Chat Room With Support

ASIANPAINT-indian-St...

Related

CSX Stock Forecast Using Elliott Wave Points to Bullish Trend Continuation With Clear Target of $50 Amid Strong Momentum

CSX Stock Forecast Using Elliott Wave Points to Bullish Trend Continuation With Clear Target of $50 Amid Strong Momentum

Elliott Wave analysis shows CSX in a bullish impulsive phase. Wave 3 formation suggests strength, wi...

Read More >
Euro/ U.S. Dollar (EURUSD) Forex Elliott Wave Technical Analysis: Daily and 4-Hour Chart Insights for Effective Forex Trading

Euro/ U.S. Dollar (EURUSD) Forex Elliott Wave Technical Analysis: Daily and 4-Hour Chart Insights for Effective Forex Trading

This comprehensive EURUSD Elliott Wave Analysis covers both daily and 4-hour charts, offering in-dep...

Read More >
Market Dynamics and Future movements on S&P/TSX 60 Index Elliott Wave Technical Analysis

Market Dynamics and Future movements on S&P/TSX 60 Index Elliott Wave Technical Analysis

The S&P/TSX 60 Elliott Wave analysis provides a comprehensive look at the day and weekly charts, foc...

Read More >
Meta Platforms Inc. Stocks Elliott Wave Technical Analysis - Charts show an ongoing Bullish Trend Highlighting key Resistance Levels

Meta Platforms Inc. Stocks Elliott Wave Technical Analysis - Charts show an ongoing Bullish Trend Highlighting key Resistance Levels

This analysis of Meta Platforms (META) provides a detailed Elliott Wave forecast, highlighting key r...

Read More >
Cardano (ADAUSD) Elliott Wave Technical  Analysis, Price Prediction, Trading Strategies, Support & Resistance, and Market Trends

Cardano (ADAUSD) Elliott Wave Technical Analysis, Price Prediction, Trading Strategies, Support & Resistance, and Market Trends

Elliott Wave analysis of ADAUSD, including price predictions, trading strategies, and risk managemen...

Read More >
Commodity Market Update: Forecast for Gold, Silver, and Base Metals Amid Rising US Dollar and Treasury Yields

Commodity Market Update: Forecast for Gold, Silver, and Base Metals Amid Rising US Dollar and Treasury Yields

This commodity market update highlights expectations for key financial instruments and commodities i...

Read More >

$1 for 2 Weeks

then $29 a month!

What a Special Offer!

Trade Recommendations

Unleash the power of deversified trading with our comprehensive portfolio, covering 250+ markets:

  • Stock Trades
  • Crypto Trades
  • Forex Trades
  • Commodity Trades
Elliott Wave Analysis

Gain a competitive edge with expert insights and AI-powered Elliott Wave charting into:

  • Global Indices
  • US Stocks & ASX Stocks
  • Forex & Crypto
  • Commodities
Top-Notch Trading Tools

Equip yourself with the tools of success:

  • Real-time Chat rooms
  • Elliott Wave Algorithm
  • Portfolio tools
  • TradingLevels
  • Screener
  • Trading Game
7 Elliott Wave Analysts

Stay ahead of the market with daily charts and insightful videos
Your secret to strategic trading!

JOIN HERE


Welcome to TradingLounge (ASIC A.R.No. 321187), specialists in trades, trading education and technical analysis, covering stocks, indices, commodities, forex and cryptocurrencies.

When you join TradingLounge you have access to everything we offer, including trade tools, educational content and a social platform to chat with like-minded investors.

Read more

@Copyright 2024 by tradinglounge.com

Contact Us

Australian no: 02 4787 6020

International no: +61 (2) 47876020

Pay with:

Find us on