15May

Nifty 50 Elliott Wave Analysis Highlights Bullish Impulse With Key Wave Counts and Support Levels for Informed Trading Strategy

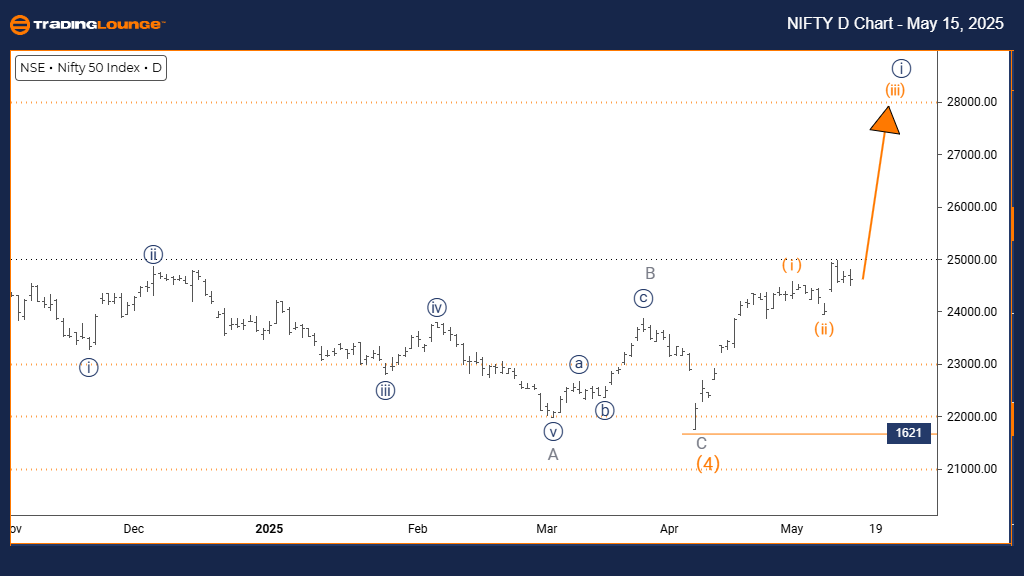
NIFTY 50 INDEX Elliott Wave Analysis – Trading Lounge Daily Chart

NIFTY 50 INDEX Technical Daily Chart Outlook

NIFTY 50 INDEX Elliott Wave Technical Outlook

Function: Bullish Trend

Mode: Impulsive

Structure: Orange Wave 3

Position: Navy Blue Wave 1

Next Lower Degree Direction: Orange Wave 4

Technical Overview:
The Nifty 50 daily chart highlights a strong bullish trend based on Elliott Wave theory. Currently, Orange Wave 3 is advancing within Navy Blue Wave 1, indicating a confirmed end of the prior corrective Orange Wave 2. This phase often suggests a robust upside potential as part of the most aggressive segment in an impulsive wave cycle.

Wave Invalidation Level: 1621 – A drop below this level would invalidate the current bullish wave structure and signal the potential for a complex corrective phase or reversal.

This setup indicates institutional buying pressure, reflected in the aggressive rise seen in Orange Wave 3. As this wave unfolds, the market could see further gains under the continuation of Navy Blue Wave 1.

Looking ahead, Orange Wave 4 is anticipated as a corrective movement once Orange Wave 3 completes. This projected correction provides key context for traders tracking support zones and trend continuation. Traders are advised to monitor the 1621 invalidation point closely to manage risk during this active upward phase.

NIFTY-50-INDEX-Day-C...


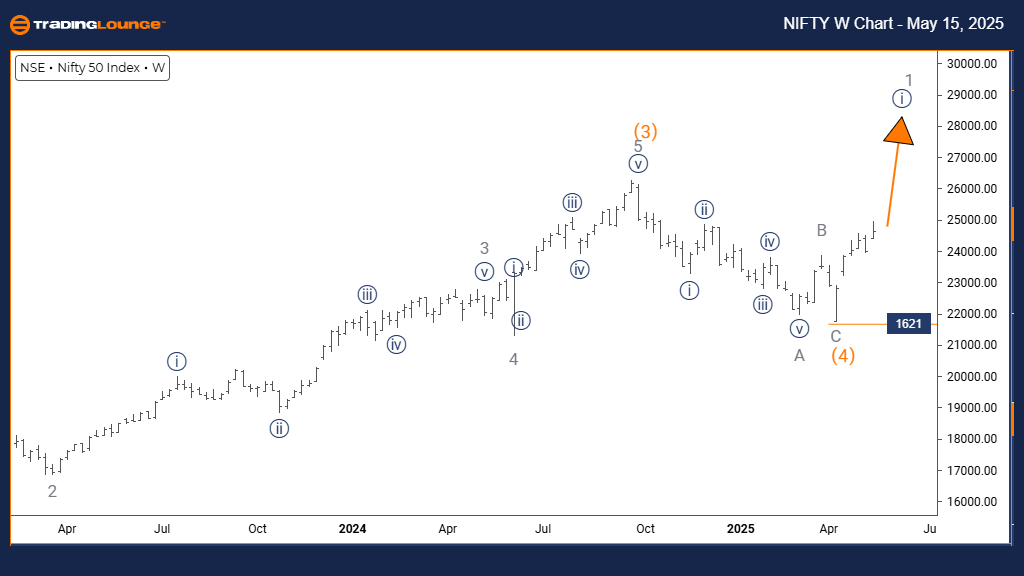
NIFTY 50 INDEX Elliott Wave Analysis – Trading Lounge Weekly Chart

NIFTY 50 INDEX Long-Term Elliott Wave Forecast

Function: Bullish Trend

Mode: Impulsive

Structure: Navy Blue Wave 1

Position: Gray Wave 1

Next Higher Degree Direction: Navy Blue Wave 1 (Initiated)

Nifty 50 Technical Outlook:

On the weekly chart, the Nifty 50 index continues to demonstrate a bullish Elliott Wave structure. The current formation of Navy Blue Wave 1 within Gray Wave 1 confirms the conclusion of the previous corrective Orange Wave 4 and signals a new leg higher.

Wave Invalidation Level: 1621 – A sustained move below this level would question the active wave structure, requiring a reassessment of the pattern or identifying a more complex correction.

This Elliott Wave progression on a larger time frame supports the start of a longer-term uptrend. With Navy Blue Wave 1 serving as the foundation of Gray Wave 1, the market is positioned for sustained upward momentum.

The impulsive nature of this structure, especially on the weekly chart, suggests renewed bullish interest, likely driven by larger market participants. Monitoring the 1621 level remains crucial as it offers a key reference point for validating the current count.

This broader wave context offers investors strategic insights into the index's primary trend. With early-stage impulsive activity underway, the structure outlines not only potential for extended gains but also critical areas to manage risk effectively.

Technical Analyst: Malik Awais

Source: Visit Tradinglounge.com and learn from the Experts. Join TradingLounge Here 

Previous: ITC INDIA Elliott Wave Technical Analysis

VALUE Offer - Buy 1 Month & Get 3 Months!Click here

Access 7 Analysts Over 200 Markets Covered. Chat Room With Support

NIFTY-50-INDEX-weekl...

Related

Elliott Wave Analysis of SGX TSI Iron Ore Futures: Unveiling Commodity Market Trends, Price Forecasts, and Trading Strategies

Elliott Wave Analysis of SGX TSI Iron Ore Futures: Unveiling Commodity Market Trends, Price Forecasts, and Trading Strategies

This article provides a detailed Elliott Wave analysis of the SGX TSI Iron Ore Futures, highlighting...

Read More >
Implementing Effective Forex Trading Strategies Using Euro/U.S.Dollar (EURUSD) Forex Elliott Wave Technical Analysis

Implementing Effective Forex Trading Strategies Using Euro/U.S.Dollar (EURUSD) Forex Elliott Wave Technical Analysis

The EURUSD Elliott Wave analysis provides a comprehensive look at the current market trends, focusin...

Read More >
Elliott Wave analysis of Commonwealth Bank of Australia (CBA) Stock Provides Insights into the Current Market trends on the ASX

Elliott Wave analysis of Commonwealth Bank of Australia (CBA) Stock Provides Insights into the Current Market trends on the ASX

This comprehensive Elliott Wave analysis of Commonwealth Bank of Australia (CBA) stock provides insi...

Read More >
Gold XAUUSD Commodity Elliott Wave Analysis: Explore the Current Price Trends, Wave Structures, and Future Projections

Gold XAUUSD Commodity Elliott Wave Analysis: Explore the Current Price Trends, Wave Structures, and Future Projections

In this comprehensive Gold Elliott Wave Analysis, we explore the current price trends, wave structur...

Read More >
Insights for Traders on ChainLink's Price Movement, Trading Strategies and Technical Indicators: LINKUSD Elliott Wave Analysis

Insights for Traders on ChainLink's Price Movement, Trading Strategies and Technical Indicators: LINKUSD Elliott Wave Analysis

This detailed analysis covers ChainLink (LINKUSD) price prediction using Elliott Wave theory, focusi...

Read More >
ADANI PORTS & SEZ - ADANIPORT Elliott Wave Forecast Shows Bullish Trend With Key 1040 Support

ADANI PORTS & SEZ - ADANIPORT Elliott Wave Forecast Shows Bullish Trend With Key 1040 Support

Elliott Wave analysis of Adani Ports & SEZ reveals a bullish impulsive trend with upward potential a...

Read More >

$1 for 2 Weeks

then $29 a month!

What a Special Offer!

Trade Recommendations

Unleash the power of deversified trading with our comprehensive portfolio, covering 250+ markets:

  • Stock Trades
  • Crypto Trades
  • Forex Trades
  • Commodity Trades
Elliott Wave Analysis

Gain a competitive edge with expert insights and AI-powered Elliott Wave charting into:

  • Global Indices
  • US Stocks & ASX Stocks
  • Forex & Crypto
  • Commodities
Top-Notch Trading Tools

Equip yourself with the tools of success:

  • Real-time Chat rooms
  • Elliott Wave Algorithm
  • Portfolio tools
  • TradingLevels
  • Screener
  • Trading Game
7 Elliott Wave Analysts

Stay ahead of the market with daily charts and insightful videos
Your secret to strategic trading!

JOIN HERE


Welcome to TradingLounge (ASIC A.R.No. 321187), specialists in trades, trading education and technical analysis, covering stocks, indices, commodities, forex and cryptocurrencies.

When you join TradingLounge you have access to everything we offer, including trade tools, educational content and a social platform to chat with like-minded investors.

Read more

@Copyright 2024 by tradinglounge.com

Contact Us

Australian no: 02 4787 6020

International no: +61 (2) 47876020

Pay with:

Find us on