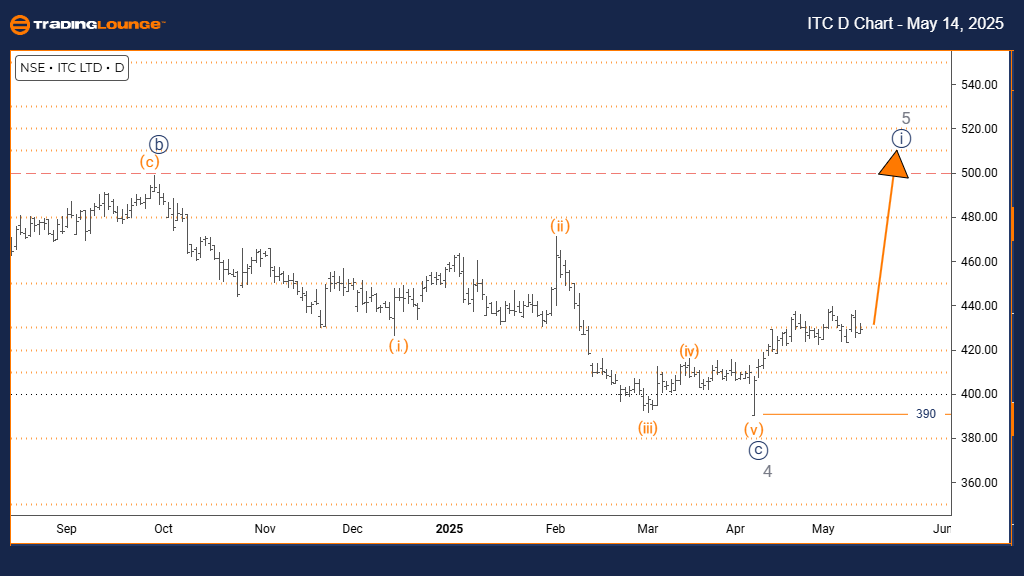
ITC INDIA Elliott Wave Analysis – Trading Lounge Day Chart
ITC INDIA Elliott Wave Technical Analysis
FUNCTION: Bullish Trend
MODE: Impulsive
STRUCTURE: Navy Blue Wave 1
POSITION: Gray Wave 5
DIRECTION NEXT LOWER DEGREES: Navy Blue Wave 2
DETAILS:
Gray Wave 4 has likely completed, with the emergence of Navy Blue Wave 1 marking the early stages of Gray Wave 5’s progression.
Wave Cancel Invalid Level: 390
The daily Elliott Wave chart for ITC India highlights a clear bullish trajectory. An impulsive structure confirms that Navy Blue Wave 1 is forming as part of the broader Gray Wave 5 trend. This points to a completed Gray Wave 4, ushering in a new upward momentum phase, typically associated with the final leg in a larger five-wave bullish sequence.
With this new wave development underway, the structure suggests strong market sentiment favoring ITC’s rise. The technical invalidation threshold is set at 390—any price drop below this level would negate the current wave count and imply a potential shift in market direction or a reassessment of the Elliott structure.
Looking ahead, the anticipated completion of Navy Blue Wave 1 should lead into a corrective Navy Blue Wave 2. This unfolding pattern provides valuable insights into ITC’s intermediate positioning within its overall bullish cycle. While upward potential remains in focus, traders should prepare for a likely pullback before the trend resumes.
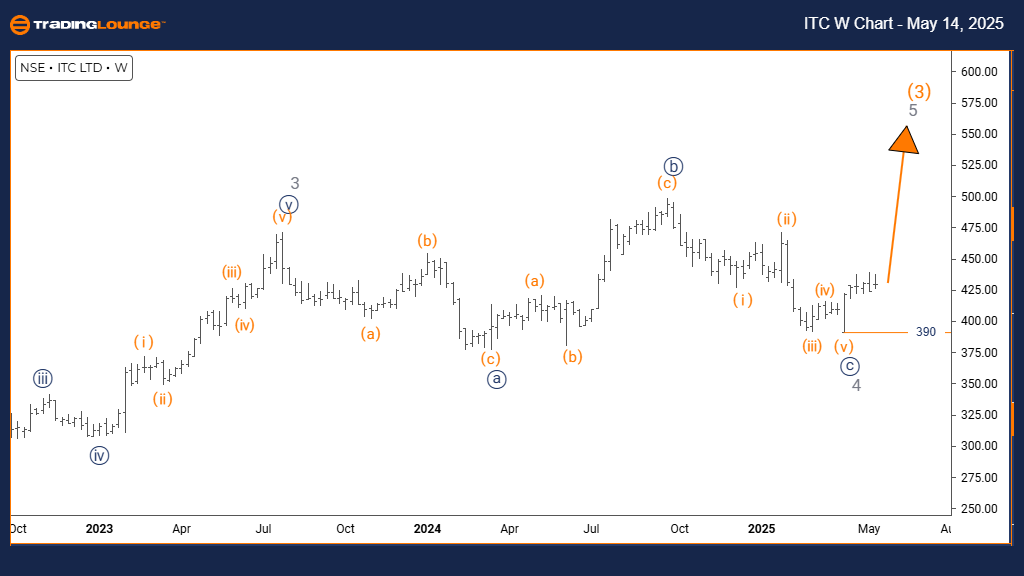
ITC INDIA Elliott Wave Analysis – Trading Lounge Weekly Chart
ITC INDIA Elliott Wave Technical Analysis
FUNCTION: Bullish Trend
MODE: Impulsive
STRUCTURE: Gray Wave 5
POSITION: Orange Wave 3
DIRECTION NEXT HIGHER DEGREES: Gray Wave 5 (in progress)
DETAILS:
Gray Wave 4 has concluded, with Gray Wave 5 actively advancing.
Wave Cancel Invalid Level: 390
On the weekly chart, ITC India displays sustained bullish behavior underpinned by an impulsive Elliott Wave pattern. The present setup confirms Gray Wave 5 is progressing, and price action is currently situated in Orange Wave 3—a powerful upward move often reflecting strong institutional buying before a market peaks.
Technical validation remains intact above ₹390, the defined invalidation level. A drop below this point would indicate the wave count is incorrect or the trend may be reversing earlier than expected. Until then, the chart signals further upside is plausible within this terminal wave structure.
This higher-timeframe analysis strengthens the bullish case, identifying Gray Wave 5 as the last significant rise in this Elliott sequence. Though nearing completion, the market structure still offers trading opportunities as long as wave progression maintains momentum. Vigilance around the invalidation threshold is crucial for effective risk management.
Technical Analyst: Malik Awais
Source: Visit Tradinglounge.com and learn from the Experts. Join TradingLounge Here
Previous: ADANI ENTERPRISES Elliott Wave Technical Analysis
VALUE Offer - Buy 1 Month & Get 3 Months!Click here
Access 7 Analysts Over 200 Markets Covered. Chat Room With Support