Commodity: Gold XAUUSD Elliott Wave Analysis
Function: Counter-Trend
Mode: Corrective
Structure: Triangle for wave 4
Position: Wave 4
Direction: Wave 4 is still in play
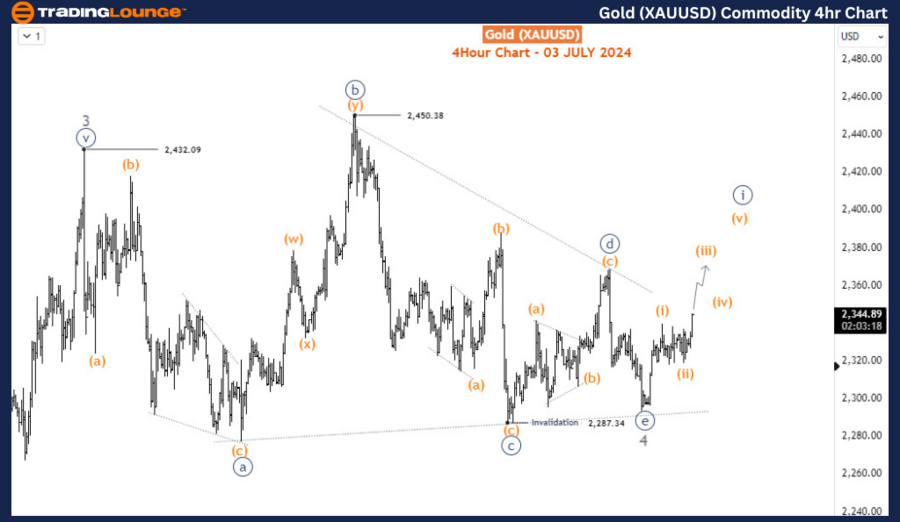
Details: Gold completes a triangle for wave 4. The commodity favors the upside in wave 5 if it escapes the congestion. Invalidation remains at 2287.34.
Gold XAUUSD Elliott Wave Technical Analysis
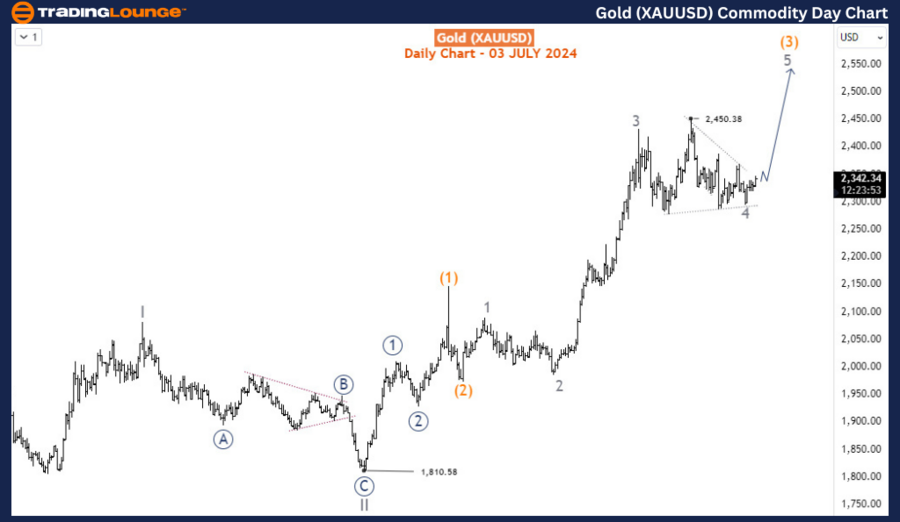
Gold has been moving sideways for over 11 weeks after retracing the bullish trend that started in October 2023. The commodity is expected to break to the upside to continue the trend.
Gold XAUUSD Daily Chart Analysis
A bullish impulse wave pattern emerged from September 2022 where the supercycle wave (IV) ended at 1616.9. From there, the supercycle wave (V) began. Wave I of (V) ended in May 2023 at 2081.8 before pulling back in wave II of (V), which ended at 1810.58 in October 2023. From October 2023 at 1810, wave III of (V) began, pushing the commodity to fresh highs multiple times in 2024. Price is currently in wave 4 of (3) of III of (V), which has not completed a triangle pattern typical of 4th waves. Wave 5 of (3) is now expected to rise toward 2576-2749.

Gold XAUUSD H4 Chart Analysis
The sub-waves of wave 4 are in a triangle sideways structure. Alternatively, it could form a double zigzag if the price breaches the triangle invalidation level at 2287.34. However, if the price stays above the invalidation level and breaks outside of the triangle, then the sub-waves of wave 5 are expected to emerge into either an impulse wave or an ending diagonal pattern.
Technical Analyst: Sanmi Adeagbo
Source: visit Tradinglounge.com and learn From the Experts Join TradingLounge Here
See Previous: Copper Elliott Wave Technical Analysis
Special Trial Offer - 0.76 Cents a Day for 3 Months! Click here
Access 7 Analysts Over 170 Markets Covered. Chat Room With Support
