TradingLounge Copper Elliott Wave Analysis

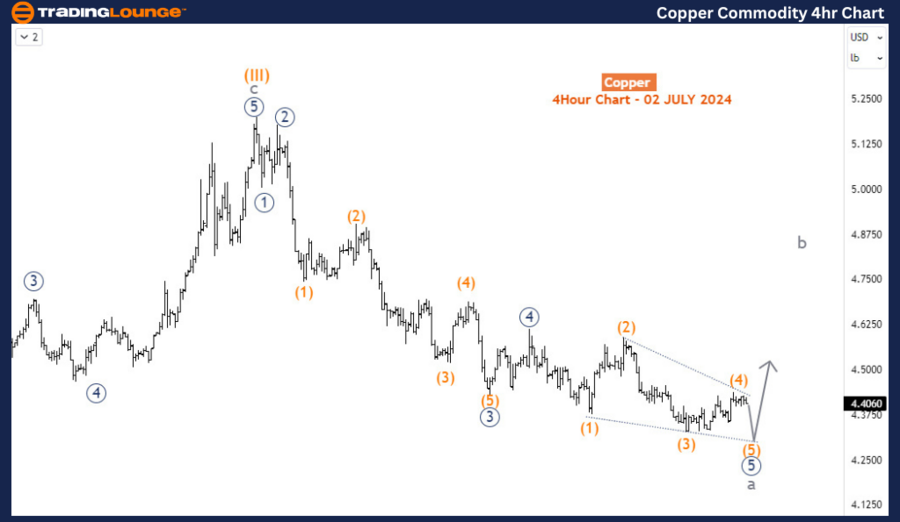
Function: Counter-Trend

Mode: Impulse wave a of (IV)

Structure: Impulse wave

Position: Wave (3) of 5 (circled)

Direction: Wave (4)

Details: The decline from May 20th is best described as an impulse structure. The price is expected to drop further to complete the cycle degree wave a. Currently, it is in wave 5 (circled) of the cycle degree, nearing the end of an ending diagonal structure.

Copper Elliott Wave Technical Analysis

Since May 17th, 2024, Copper has lost nearly 15%, correcting the strong rally from October 2023. The correction from May 2024 seems to be deeper, aiming to complete at least a 3-swing chart structure. However, the long-term trend still indicates an upside, but buyers should proceed with caution. Before the decline continues, the commodity might experience a minor bounce, correcting the current sell-off from May 17th, 2024.

In the long term, Copper appears to be in a bullish corrective cycle - wave A-B-C of the grand supercycle degree. Wave B completed a triangle structure lasting 17 months, ending in April 2022. Since then, a bullish diagonal structure has formed for wave C of the supercycle degree. Hence, the long-term trend favors buyers, though sharp pullbacks are expected.

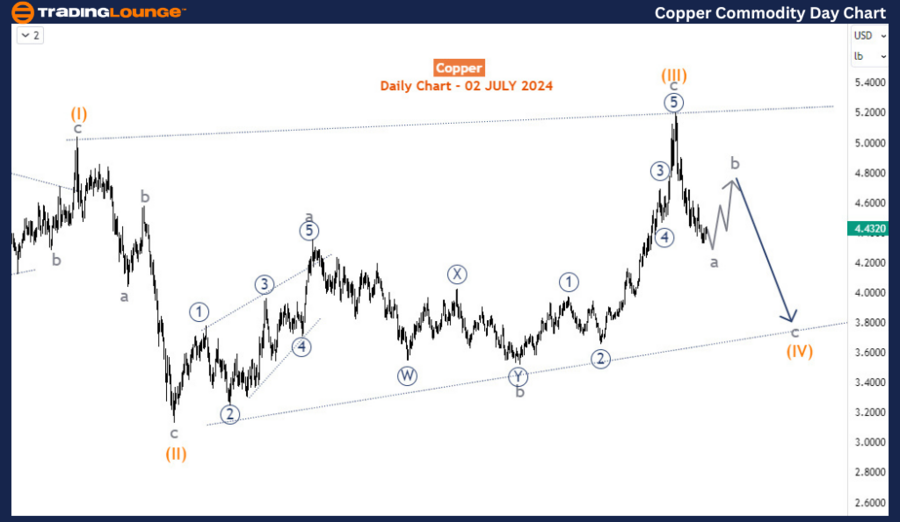
Copper Day Chart Analysis

On the daily chart, the diagonal completed its 3rd sub-wave, wave (III) of the supercycle degree, in May 2024. A decline for wave (IV) began and is currently ongoing. Wave (IV) is expected to complete a corrective structure - ABC or WXY. Wave a of (IV) is close to completion, indicating a possible resurgence for wave b of (IV). The H4 chart shows the extent of wave a of (IV) and its potential progression before concluding and allowing wave b to commence upwards.

Copper-Commodity-Day...


Copper 4-Hour Chart Analysis

On the H4 chart, the sell-off from May 2024 is forming into an impulse wave for wave 5 (circled) of a. Currently, it is in the sub-waves (4) of a diagonal wave 5 (circled), expected to be the last leg. If the diagonal concludes as anticipated, sellers should be cautious of a corrective surge. However, buyers should not be overly optimistic as the rally will likely be corrective, leading to another round of sell-offs before wave (IV) ends and the price starts pushing upwards for wave (V) in the long term.

Technical Analyst: Sanmi Adeagbo

Source: visit Tradinglounge.com and learn From the Experts Join TradingLounge Here 

See Previous: GX Uranium ETF Elliott Wave Technical Analysis

Special Trial Offer - 0.76 Cents a Day for 3 Months! Click here

Access 7 Analysts Over 170 Markets Covered. Chat Room With Support

Copper-Commodity-4hr...

Related

NIFTY 50 Elliott Wave Analysis – Market Trend Forecast, Impulse & Corrective Waves, Trading Signals, and Stock Market Predictions

NIFTY 50 Elliott Wave Analysis – Market Trend Forecast, Impulse & Corrective Waves, Trading Signals, and Stock Market Predictions

NIFTY 50 Elliott Wave analysis, highlighting market trends, impulse waves, and corrective structures...

Read More >
PaloAlto Networks Inc. stock price towards key levels: PANW Elliott Wave Technical Analysis and Potential Upside

PaloAlto Networks Inc. stock price towards key levels: PANW Elliott Wave Technical Analysis and Potential Upside

This detailed analysis of Palo Alto Networks (PANW) stock uses Elliott Wave Theory to explore the cu...

Read More >
EURUSD Elliott Wave Analysis: Expert Forex Forecast, Trading Strategies, and Market Trends for Informed Decisions

EURUSD Elliott Wave Analysis: Expert Forex Forecast, Trading Strategies, and Market Trends for Informed Decisions

EURUSD Elliott Wave analysis to stay ahead in the forex market. Learn about key chart patterns, mar...

Read More >
GX Uranium ETF (URA) Commodity Elliott Wave Technical Analysis: Navigating Market Corrections

GX Uranium ETF (URA) Commodity Elliott Wave Technical Analysis: Navigating Market Corrections

This detailed analysis of the GX Uranium ETF (URA) using Elliott Wave theory provides an in-depth lo...

Read More >
NEOUSD Elliott Wave Technical Analysis: Price Prediction, Trading Strategy, Support & Resistance Levels for NEO/USD Market Trends

NEOUSD Elliott Wave Technical Analysis: Price Prediction, Trading Strategy, Support & Resistance Levels for NEO/USD Market Trends

This analysis covers the NEOUSD Elliott Wave structure, highlighting the corrective phase and tradin...

Read More >

Buy 1 Month

Get 3 Months!

Special Offer:

Trade Recommendations

Unleash the power of deversified trading with our comprehensive portfolio, covering:

  • Stock Trades
  • Crypto Trades
  • Forex Trades
  • Commodity Trades
Elliott Wave Analysis

Gain a competive edge with expert insights in to:

  • Global Indices
  • US Stocks & ASX Stocks
  • Forex & Crypto
  • Commodities
Top-Notch Trading Tools

Equip yourself with the tools of success:

  • Social Chat
  • Elliott Wave Algorithm
  • Screener
  • TradingLevels
  • Trading Game
7 Elliott Wave Analysts

Stay ahead of the market with daily charts and insightful videos
-Your secret to strategic trading!

JOIN HERE


Welcome to TradingLounge (ASIC A.R.No. 321187), specialists in trades, trading education and technical analysis, covering stocks, indices, commodities, forex and cryptocurrencies.

When you join TradingLounge you have access to everything we offer, including trade tools, educational content and a social platform to chat with like-minded investors.

Read more

@Copyright 2024 by tradinglounge.com

Contact Us

Australian no: 02 4787 6020

International no: +61 (2) 47876020

Pay with:

Find us on