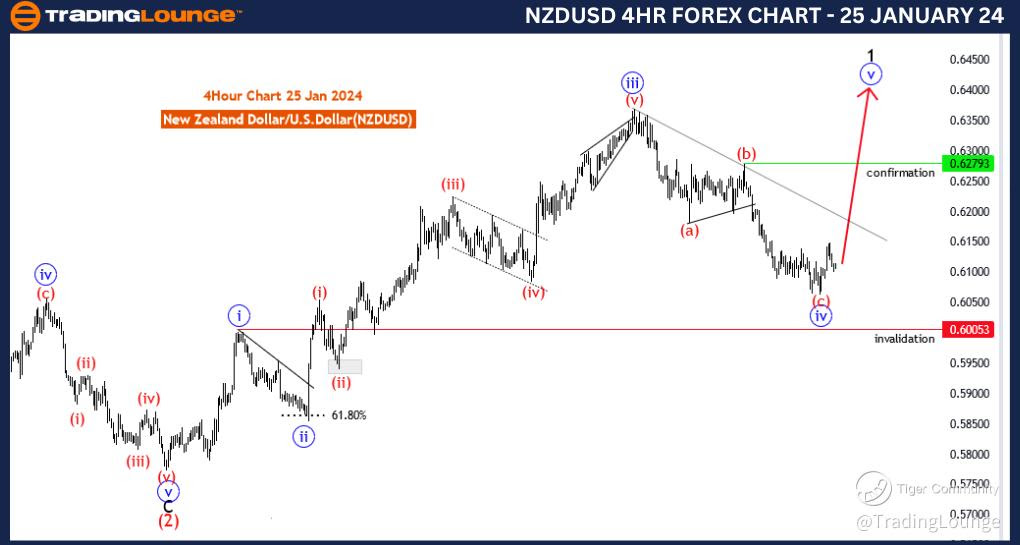
NZDUSD Elliott Wave Analysis Trading Lounge 4 Hour Chart, 25 January 24
New Zealand Dollar/U.S.Dollar (NZDUSD) 4 Hour Chart
NZDUSD Elliott Wave Technical Analysis
Function: Trend
Mode: impulsive
Structure: blue wave 5 of 1
Position: Red wave 3
Direction Next Higher Degrees: Blue wave 5 of 1(started)
Details; blue wave 4 of black wave 1 looking completed at 0.60622 , now blue wave 5 of 1 is in play . Wave Cancel invalid level: 0.60053
The "NZDUSD Elliott Wave Analysis Trading Lounge 4 Hour Chart" for 25 January 24, provides an in-depth examination of the New Zealand Dollar/U.S. Dollar (NZDUSD) currency pair using the Elliott Wave theory, a popular tool in technical analysis.
The stated "Function" is to identify the prevailing "Trend," with a focus on understanding and leveraging the current directional movement in the market. This aligns with traders' goals of aligning their strategies with the existing trend for optimal trading outcomes.
The specified "Mode" is "Impulsive," indicating a market phase characterized by strong and decisive movements. In Elliott Wave terms, impulsive waves typically consist of five subwaves (1, 2, 3, 4, 5), signifying a strong and sustained directional move.
The identified "Structure" involves the assessment of "blue wave 5 of 1," indicating a detailed analysis of the subwave patterns within the broader structure of black wave 1. This approach allows for a granular understanding of the ongoing trend.
The "Position" is defined as "Red wave 3," indicating the current phase within the Elliott Wave count. blue wave 5 of 1 is a subwave within the larger structure of Red wave 3.
Concerning the "Direction Next Higher Degrees," the focus is on the potential continuation of "Blue wave 5 of 1 (started)." This implies an anticipation that the broader trend of blue wave 5 of 1 is currently underway.
In the "Details" section, it is highlighted that "blue wave 4 of black wave 1 looking completed at 0.60622," suggesting the conclusion of a corrective phase within the larger structure. The narrative further notes that "blue wave 5 of 1 is in play," indicating the potential for a continuation of the impulsive move.
The "Wave Cancel invalid level" is identified as "0.60053." This level serves as a crucial reference point, suggesting that a breach of this level could invalidate the current wave count. Such a breach might prompt a reassessment of the analysis and could imply a potential change in the anticipated market direction.
In summary, the NZDUSD Elliott Wave Analysis for the 4 Hour Chart on 25 January 24, suggests an impulsive trend, with the completion of a corrective phase (wave 4) and the initiation of the impulsive phase of blue wave 5 of 1. Traders are advised to stay vigilant, with a focus on the invalidation level at 0.60053.
Technical Analyst: Malik Awais
Source: Tradinglounge.com get trial here!
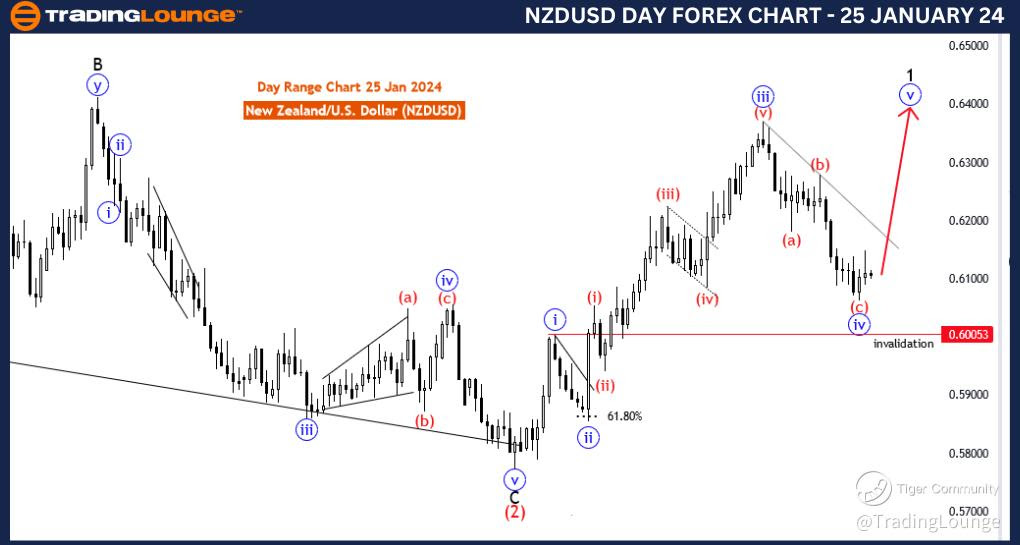
NZDUSD Elliott Wave Analysis Trading Lounge Day Chart, 25 January 24
New Zealand Dollar/U.S.Dollar (NZDUSD) Day Chart
NZDUSD Elliott Wave Technical Analysis
Function: Trend
Mode: impulsive
Structure: blue wave 5 of 1
Position: Red wave 3
Direction Next Lower Degrees: black wave 2
Details; blue wave 4 of black wave 1 looking completed at 0.60622 , now blue wave 5 of 1 is in play . Wave Cancel invalid level: 0.60053
The "NZDUSD Elliott Wave Analysis Trading Lounge Day Chart" for 25 January 24, provides a comprehensive analysis of the New Zealand Dollar/U.S. Dollar (NZDUSD) currency pair using Elliott Wave theory, a prominent technical analysis tool.
The specified "Function" is to identify the prevailing "Trend." The emphasis on trend analysis aligns with the goal of traders to understand and capitalize on the dominant market direction.
The identified "Mode" is "Impulsive," signaling a market characterized by decisive and forceful movements. In Elliott Wave theory, impulsive waves typically consist of five subwaves (1, 2, 3, 4, 5), indicating strong directional momentum.
The analyzed "Structure" focuses on "blue wave 5 of 1," delving into the detailed subwave patterns within the broader context of black wave 1. This nuanced approach allows for a more granular understanding of the ongoing trend.
The "Position" is described as "Red wave 3," signifying the current phase within the Elliott Wave count. blue wave 5 of 1 is a subwave within the larger structure of Red wave 3.
The "Direction Next Lower Degrees" points to "black wave 2," suggesting that the analysis considers the broader context beyond the current wave. Understanding the potential retracement levels is crucial for traders anticipating corrective movements.
In the "Details" section, the analysis highlights that "blue wave 4 of black wave 1" is seemingly completed at 0.60622. This indicates the conclusion of a corrective phase within the larger structure. The narrative goes on to mention that "blue wave 5 of 1 is in play," suggesting the initiation of the next impulsive phase.
The "Wave Cancel invalid level" is specified as "0.60053." This level serves as a critical reference point, suggesting that a breach of this level could invalidate the current wave count. Traders typically use such invalidation levels to assess the accuracy of their analyses and to adapt to potential changes in market dynamics.
In summary, the NZDUSD Elliott Wave Analysis for the Day Chart on 25 January 24, indicates an impulsive trend with the completion of a corrective phase (wave 4) and the initiation of the impulsive phase of blue wave 5 of 1. Traders are advised to monitor the market closely, with a keen focus on the invalidation level at 0.60053.
Technical Analyst: Malik Awais
Source: Tradinglounge.com get trial here!
Previous: EURUSD