14May

SuperMicro Computers Inc. (SMCI) Stock Elliott Wave Analysis Shows Corrective Pattern Nearing Resistance with Short-Term Upside

This updated Elliott Wave analysis examines SuperMicro Computers Inc. (SMCI) through daily and intraday charts, offering insights into its ongoing corrective wave structure. The corrective pattern suggests limited upside as wave {c} nears resistance, hinting that the cycle could soon conclude.


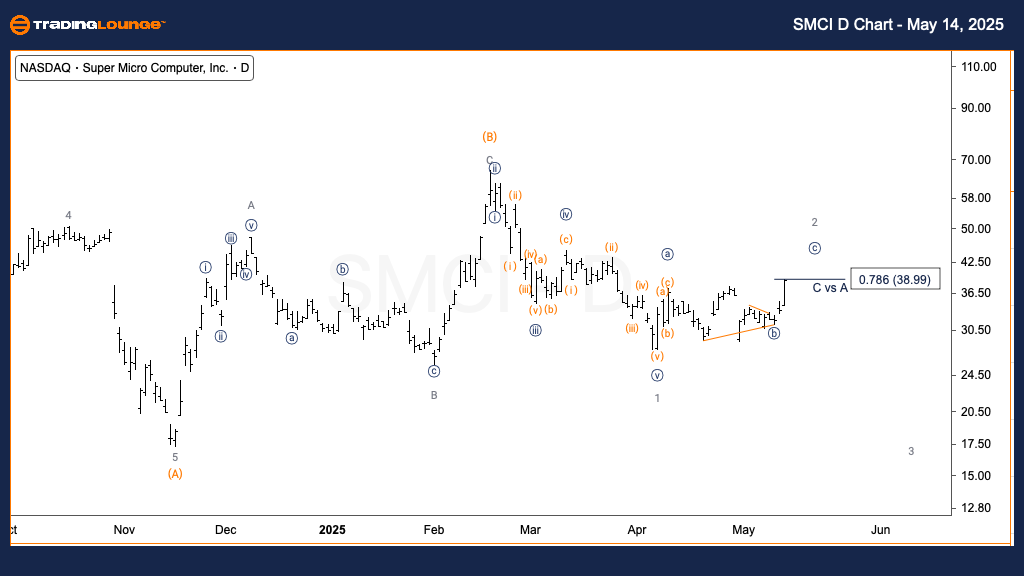
SuperMicro Computers Inc. (SMCI) Elliott Wave Analysis – Trading Lounge Daily Chart

SMCI Elliott Wave Forecast – Daily Timeframe

FUNCTION: Counter Trend

MODE: Corrective

STRUCTURE: Flat

POSITION: Wave {c} of 2

DIRECTION: Short-term Upside in wave {c}

Technical Insight:
SMCI’s current Elliott Wave setup shows a developing rally within wave {c} of wave 2. This move, stemming from the April 7 low, lacks the traits of a strong bullish impulse. Instead, it supports the structure of a larger flat correction. Based on Elliott Wave principles, limited upside remains in wave {c}, with the expectation that this upward leg will complete soon—potentially signaling the resumption of a downward correction.

SMCI-d-us-stock-char...


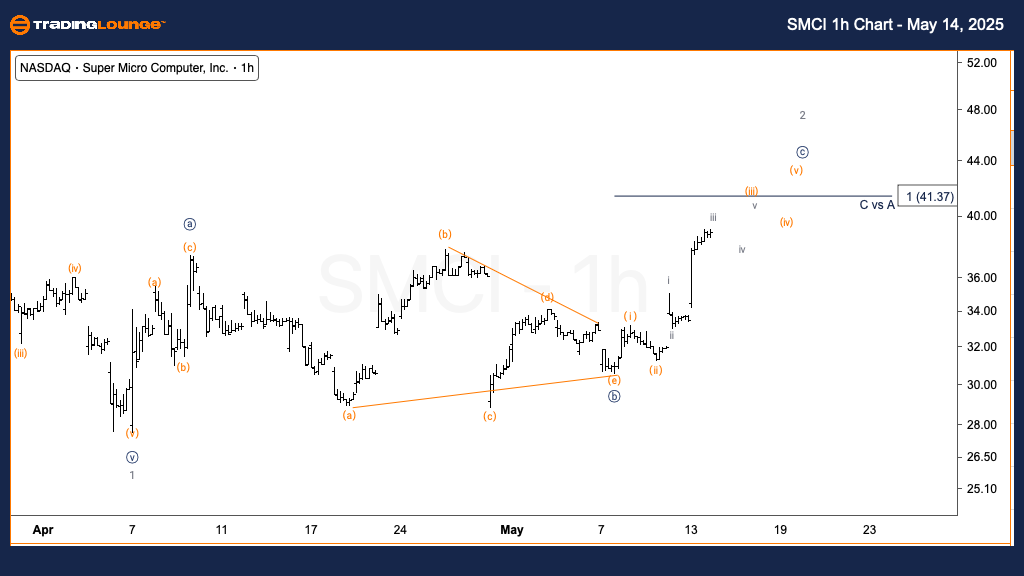
SuperMicro Computers Inc. (SMCI) Elliott Wave Analysis – Trading Lounge 1H Chart

SMCI Elliott Wave Forecast – Intraday Timeframe

FUNCTION: Counter Trend

MODE: Corrective

STRUCTURE: Flat

POSITION: Wave (iii) of {c}

DIRECTION: Upside in wave (iii)

Technical Insight:
On the 1-hour chart, SMCI is advancing within wave (iii) of {c}, pointing to a progressing internal wave structure inside the corrective phase. Momentum analysis suggests this wave is still unfolding. A key resistance level lies near the $41 mark—where wave {c} may equal wave {a} in magnitude. This price zone could become a significant pivot or reversal point, marking the end of the corrective rally.

Technical Analyst: Alessio Barretta

Source: Visit Tradinglounge.com and learn from the Experts. Join TradingLounge Here 

Previous: Exxon Mobil Inc. (XOM) Elliott Wave Technical Analysis

VALUE Offer - Buy 1 Month & Get 3 Months!Click here

Access 7 Analysts Over 200 Markets Covered. Chat Room With Support

SMCI-1h-us-stock-cha...

Related

New Zealand Dollar/U.S.Dollar (NZDUSD) Forex Elliott Wave Technical Analysis: Comprehensive Market Forecast

New Zealand Dollar/U.S.Dollar (NZDUSD) Forex Elliott Wave Technical Analysis: Comprehensive Market Forecast

This article provides an in-depth Elliott Wave Analysis of the NZDUSD pair on both the daily and 4-h...

Read More >
KOTAK BANK Elliott Wave Technical Analysis: Bullish Trend Breakdown, Share Price Forecast, and Strategic Trading Setup

KOTAK BANK Elliott Wave Technical Analysis: Bullish Trend Breakdown, Share Price Forecast, and Strategic Trading Setup

Elliott Wave analysis of KOTAK BANK on both daily and weekly charts. It outlines the bullish structu...

Read More >
Anticipate the Forex Market Movements for the Australian Dollar against the U.S. Dollar: AUDUSD Elliott Wave Technical Analysis

Anticipate the Forex Market Movements for the Australian Dollar against the U.S. Dollar: AUDUSD Elliott Wave Technical Analysis

This analysis covers the AUDUSD pair using Elliott Wave theory, providing key insights into current ...

Read More >
Super Micro Computers Inc. (SMCI) Stocks Elliott Wave Technical Analysis: Stock Chart Trends, and Possible Breakouts

Super Micro Computers Inc. (SMCI) Stocks Elliott Wave Technical Analysis: Stock Chart Trends, and Possible Breakouts

This article provides a comprehensive Elliott Wave analysis of SuperMicro Computers Inc. (SMCI). It ...

Read More >
Swiss Market Index Elliott Wave Technical Analysis: Covers All Essential Aspects of SMI Trading  and Looking for Bullish Trends

Swiss Market Index Elliott Wave Technical Analysis: Covers All Essential Aspects of SMI Trading and Looking for Bullish Trends

This article thoroughly analyses the Swiss Market Index (SMI) using Elliott Wave theory, offering va...

Read More >
Understanding of the EURUSD's Forecast, Counter-Trend Movements, and Potential Market Shifts: EURUSD Elliott Wave Analysis

Understanding of the EURUSD's Forecast, Counter-Trend Movements, and Potential Market Shifts: EURUSD Elliott Wave Analysis

This EURUSD Elliott Wave analysis offers an in-depth view of the Euro Dollar's corrective wave p...

Read More >

$1 for 2 Weeks

then $29 a month!

What a Special Offer!

Trade Recommendations

Unleash the power of deversified trading with our comprehensive portfolio, covering 250+ markets:

  • Stock Trades
  • Crypto Trades
  • Forex Trades
  • Commodity Trades
Elliott Wave Analysis

Gain a competitive edge with expert insights and AI-powered Elliott Wave charting into:

  • Global Indices
  • US Stocks & ASX Stocks
  • Forex & Crypto
  • Commodities
Top-Notch Trading Tools

Equip yourself with the tools of success:

  • Real-time Chat rooms
  • Elliott Wave Algorithm
  • Portfolio tools
  • TradingLevels
  • Screener
  • Trading Game
7 Elliott Wave Analysts

Stay ahead of the market with daily charts and insightful videos
Your secret to strategic trading!

JOIN HERE


Welcome to TradingLounge (ASIC A.R.No. 321187), specialists in trades, trading education and technical analysis, covering stocks, indices, commodities, forex and cryptocurrencies.

When you join TradingLounge you have access to everything we offer, including trade tools, educational content and a social platform to chat with like-minded investors.

Read more

@Copyright 2024 by tradinglounge.com

Contact Us

Australian no: 02 4787 6020

International no: +61 (2) 47876020

Pay with:

Find us on