17Jul

Amcor PLC (ASX:AMC) Elliott Wave Analysis Forecasts Potential Wave 3 Breakout with Price Targets, Invalidation Levels

AMCOR PLC – AMC Elliott Wave Technical Analysis | TradingLounge

Greetings,
This Elliott Wave market update presents a current technical outlook for AMCOR PLC (ASX:AMC) listed on the Australian Stock Exchange (ASX). The price structure suggests a strong setup for a possible Wave 3 bullish advance. This report identifies essential target levels and key invalidation points supporting this wave scenario.


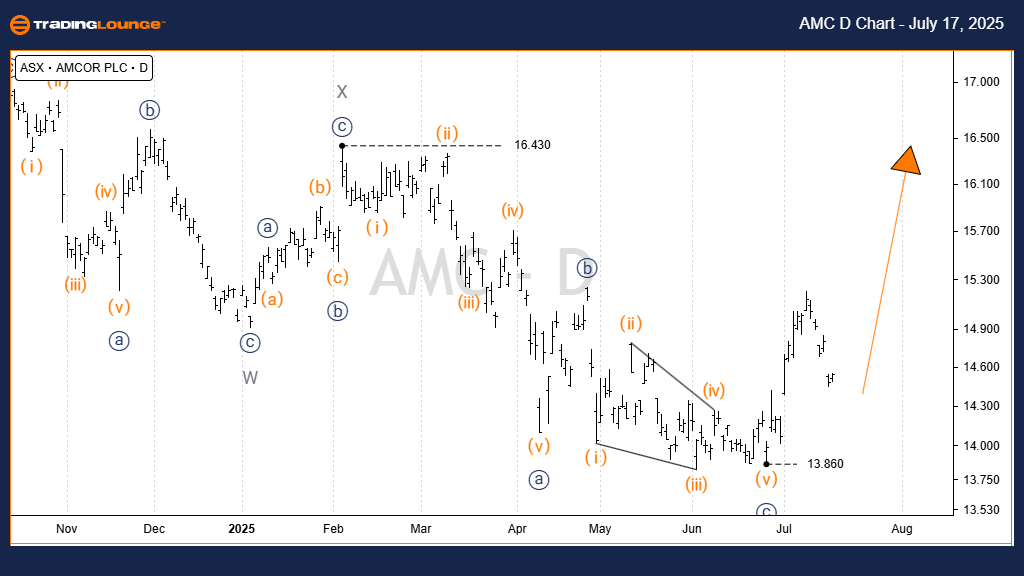
AMCOR PLC – AMC Elliott Wave Forecast and Technical Outlook 1D Chart Analysis (Semilog Scale)

Function: Major Trend (Intermediate Degree, Orange)

Mode: Motive

Structure: Impulse

Wave Position: Wave 3) – Orange

Details:
Wave 3) – Orange is forming upward. Starting from the recent low of 13.35, wave 3)) – Navy appears to be in an extended bullish formation. It subdivides into wave 1), 2) – Orange, which seem to have completed. From the low of 13.82, wave 3) – Orange is projected to continue higher, targeting a price range between 17.56 and 20.37.
To maintain this bullish momentum in wave 5)) – Navy, the price action must stay above 13.82.

Invalidation Point: 13.86

AMC-d-asx-chart-1707...


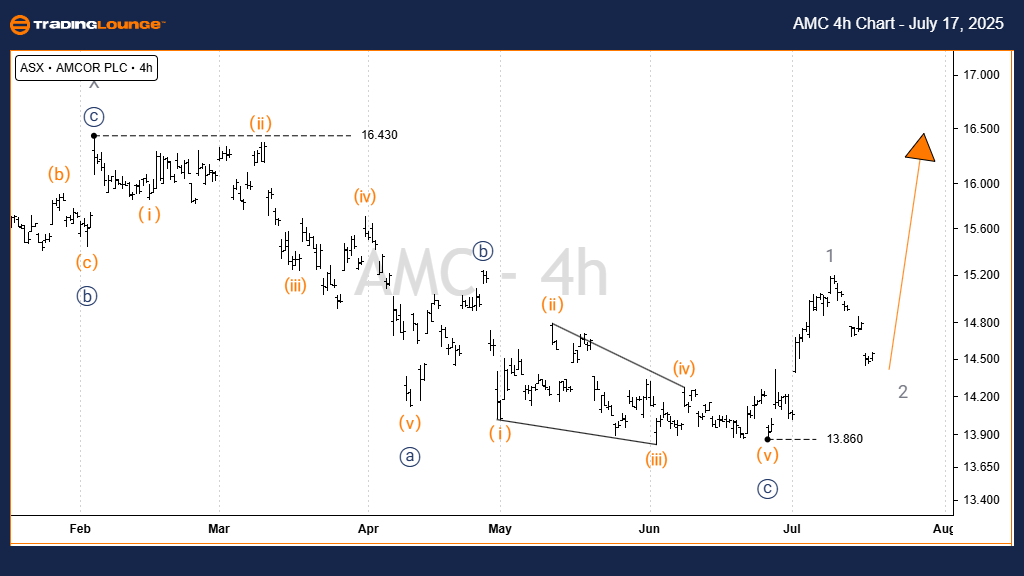
AMCOR PLC – AMC Elliott Wave Analysis | TradingLounge 4-Hour Chart Forecast

Function: Major Trend (Intermediate Degree, Orange)

Mode: Motive

Structure: Impulse

Wave Position: Wave 3) – Orange

Details:
The wave structure remains intact. Price action continues to trend upward, targeting the recent high of 16.43, with further upside potential.
Holding above the 13.86 support is essential for this bullish forecast to remain valid.

Invalidation Point: 13.86

Technical Analyst: Hua (Shane) Cuong, CEWA‑M (Certified Elliott Wave Analyst – Master Level)

Source: Visit Tradinglounge.com and learn from the Experts. Join TradingLounge Here 

See Previous: MINERAL RESOURCES LIMITED Elliott Wave Technical Analysis

VALUE Offer - Buy 1 Month & Get 3 Months!Click here

Access 7 Analysts Over 200 Markets Covered. Chat Room With Support

AMC-4h-asx-chart-170...


Conclusion

This Elliott Wave analysis on AMCOR PLC – AMC identifies key long-term price trends and short-term trading opportunities.
We highlight critical zones for wave validation and invalidation, enhancing the accuracy of our market outlook.
By combining structured technical insight with targeted price projections, our goal is to support traders with a consistent and professional market forecast.

Related

Euro/British Pound (EURGBP) Forex Elliott Wave Technical Analysis: Forecast, Bearish Trends, and Key Levels Explained

Euro/British Pound (EURGBP) Forex Elliott Wave Technical Analysis: Forecast, Bearish Trends, and Key Levels Explained

This comprehensive EURGBP Elliott Wave analysis provides insights into the ongoing bearish trend, ke...

Read More >
Unlocking The CODE: ADANI PORTS - Indian Stocks With Elliott Wave Strategy, Stock Forecast, and Market Trend

Unlocking The CODE: ADANI PORTS - Indian Stocks With Elliott Wave Strategy, Stock Forecast, and Market Trend

ADANI PORTS & SEZ examines the stock's current corrective structure on both daily and weekly cha...

Read More >
Highlighting potential future movements ASX Stock: REA GROUP LTD – REA Stock Analysis & Elliott Wave Technical Forecast

Highlighting potential future movements ASX Stock: REA GROUP LTD – REA Stock Analysis & Elliott Wave Technical Forecast

This article provides an in-depth Elliott Wave analysis of REA Group Ltd, listed on the ASX. We expl...

Read More >
Euro/ U.S. Dollar (EURUSD) Elliott Wave Technical Analysis: Technical Insights, and Market Trends for Successful Forex Trading

Euro/ U.S. Dollar (EURUSD) Elliott Wave Technical Analysis: Technical Insights, and Market Trends for Successful Forex Trading

Our in-depth Elliott Wave analysis will provide a comprehensive understanding of EURUSD's market...

Read More >
Ethereum Elliott Wave Technical Analysis Identifies ETHUSD Reversal Zone Using Fibonacci Levels and Trading Strategy

Ethereum Elliott Wave Technical Analysis Identifies ETHUSD Reversal Zone Using Fibonacci Levels and Trading Strategy

Ethereum Elliott Wave analysis shows wave C nearing completion, targeting the $1,230–$1,250 range. ...

Read More >
SPDR Financial Sector ETF (XLF) Elliott Wave Forecast: Bullish Impulse Wave, Support Levels, and Price Target Above $54 for ETF Traders

SPDR Financial Sector ETF (XLF) Elliott Wave Forecast: Bullish Impulse Wave, Support Levels, and Price Target Above $54 for ETF Traders

This analysis breaks down the current Elliott Wave structure of the SPDR Financial Sector ETF (XLF),...

Read More >

$1 for 2 Weeks

then $29 a month!

What a Special Offer!

Trade Recommendations

Unleash the power of deversified trading with our comprehensive portfolio, covering 250+ markets:

  • Stock Trades
  • Crypto Trades
  • Forex Trades
  • Commodity Trades
Elliott Wave Analysis

Gain a competitive edge with expert insights and AI-powered Elliott Wave charting into:

  • Global Indices
  • US Stocks & ASX Stocks
  • Forex & Crypto
  • Commodities
Top-Notch Trading Tools

Equip yourself with the tools of success:

  • Real-time Chat rooms
  • Elliott Wave Algorithm
  • Portfolio tools
  • TradingLevels
  • Screener
  • Trading Game
7 Elliott Wave Analysts

Stay ahead of the market with daily charts and insightful videos
Your secret to strategic trading!

JOIN HERE


Welcome to TradingLounge (ASIC A.R.No. 321187), specialists in trades, trading education and technical analysis, covering stocks, indices, commodities, forex and cryptocurrencies.

When you join TradingLounge you have access to everything we offer, including trade tools, educational content and a social platform to chat with like-minded investors.

Read more

@Copyright 2024 by tradinglounge.com

Contact Us

Australian no: 02 4787 6020

International no: +61 (2) 47876020

Pay with:

Find us on