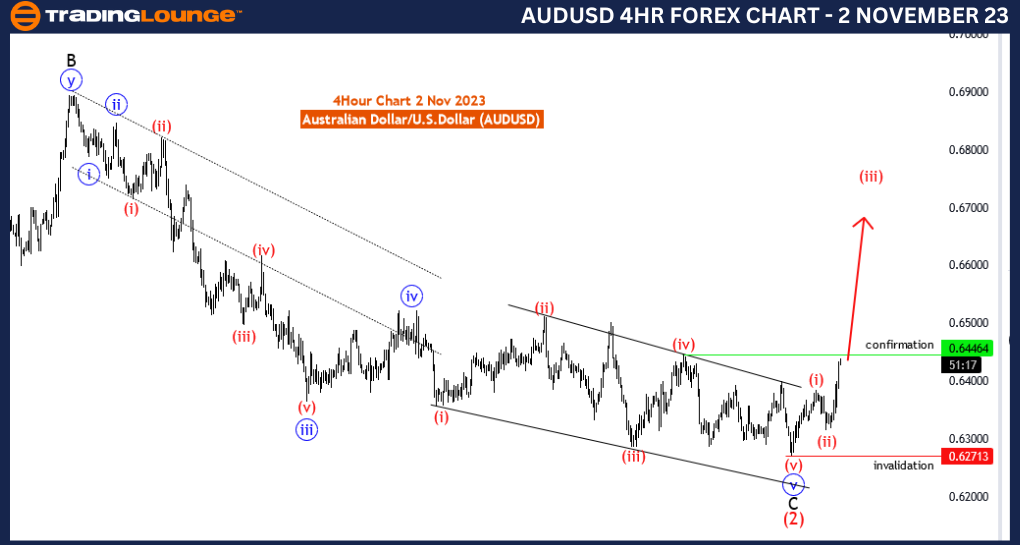
AUDUSD Elliott Wave Analysis Trading Lounge 4 Hour Chart, 2 November 23
Australian Dollar/U.S.Dollar (AUDUSD) 4 Hour Chart
AUDUSD Elliott Wave Technical Analysis
Function: Trend
Mode: impulsive
Structure: red wave 3 of 1
Position: Blue wave 1
Direction Next lower Degrees: red wave 4 of 1
Details: red wave 2 completed at 0.63144 , Now red wave 3 of 1 is in play . Wave Cancel invalid level: 0.62713
The "AUDUSD Elliott Wave Analysis Trading Lounge 4 Hour Chart" dated 2 November 23, provides a comprehensive view of the Australian Dollar/U.S. Dollar (AUD/USD) currency pair, focusing on the 4-hour chart. This analysis serves as a valuable resource for traders and investors seeking to gain a deep understanding of the current market dynamics.
The analysis designates the market function as "Trend." This suggests that the market is presently in a trending phase, indicating a sustained directional movement in one direction. In this case, the market is likely in an upward trend.
The "Mode" is categorized as "impulsive," signifying that the current price movement is part of an impulsive wave. Impulsive waves are characterized by strong and directional price movements, typically forming the primary trend.
The core focus is on "red wave 3 of 1." Within Elliott Wave theory, this designates a specific phase in the wave sequence, providing traders with a precise position within the broader wave structure. Red wave 3 is an impulsive wave that can often yield substantial trading opportunities.
The analysis specifies the "Position" as "Blue wave 1." This indicates that the market is likely in the early stages of a new bullish wave. Recognizing the commencement of a new wave is of great importance, as it can provide traders with opportunities to ride the trend.
In the "Details" section, it is noted that "red wave 2" concluded at 0.63144, and "red wave 3 of 1" is presently unfolding. This implies that after a corrective phase (red wave 2), a new impulsive wave (red wave 3) has begun. Impulsive waves often offer substantial trading potential.
The "Wave Cancel invalid level" is identified as 0.62713. This level serves as a critical reference for risk management. Should the market approach or breach this level, it might suggest potential invalidation of the existing wave count, prompting traders to reevaluate their trading strategies.
To summarize, the AUD/USD Elliott Wave Analysis on the 4-hour chart dated 2 November 23, is a vital resource for traders and investors. The identification of an impulsive wave (red wave 3) within the broader wave structure suggests an ongoing bullish trend. Traders should remain vigilant and use the invalidation level as a reference for risk management. This analysis is particularly pertinent for those aiming to capitalize on potential trading opportunities in the AUD/USD currency pair.
Technical Analyst: Malik Awais
Source: Tradinglounge.com get trial here!
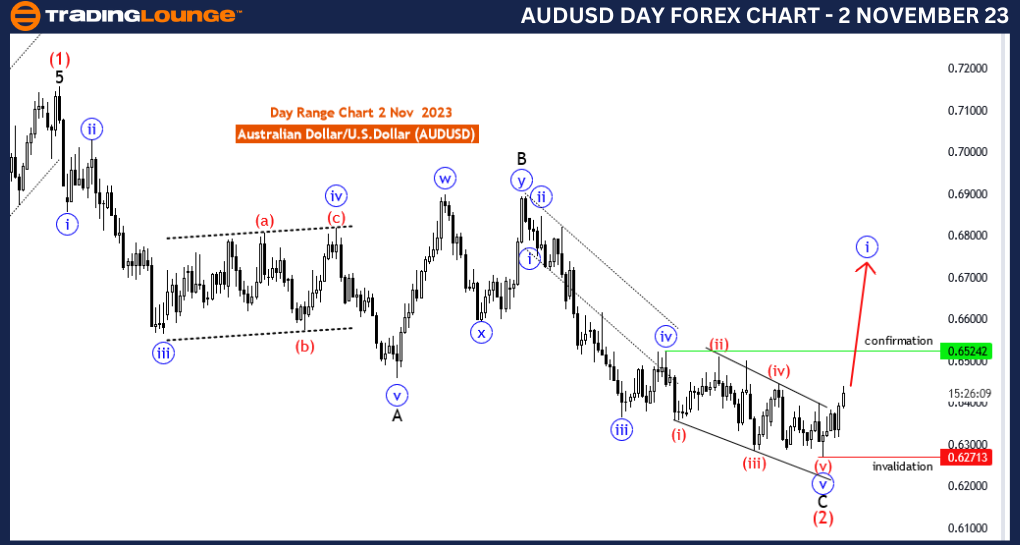
AUDUSD Elliott Wave Analysis Trading Lounge Day Chart, 2 November 23
Australian Dollar/U.S.Dollar (AUDUSD) Day Chart
AUDUSD Elliott Wave Technical Analysis
Function: Trend
Mode: impulsive
Structure: blue wave 1 of new trend
Position: black wave 1
Direction Next lower Degrees: blue wave 1 (started)
Details:wave C of 2 completed at 0.62713 , Now new upward trend as blue wave 1 is in play . Wave Cancel invalid level: 0.62713
The "AUDUSD Elliott Wave Analysis Trading Lounge Day Chart" dated 2 November 23, focuses on the Australian Dollar/U.S. Dollar (AUD/USD) currency pair using a daily chart. This analysis provides valuable insights for traders and investors seeking to comprehend the current market conditions.
The analysis identifies the market function as "Trend," suggesting that the market is currently in a trending phase. In this context, it implies that the market is likely in an uptrend, with sustained upward price movements.
The "Mode" is categorized as "impulsive." This indicates that the current price movement is part of an impulsive wave. Impulsive waves are characterized by strong and sustained price movements in the direction of the trend. In this case, the implication is that the market is in an impulsive upward move.
The core focus is on "blue wave 1 of the new trend." In Elliott Wave theory, this indicates the commencement of a new bullish wave (wave 1) within the broader wave structure. Recognizing the start of a new trend is crucial for traders as it offers opportunities for trend-following strategies.
The analysis states that "wave C of 2" has concluded at 0.62713. This suggests the completion of a corrective phase (wave 2) with the conclusion of wave C. Following the end of wave 2, a new upward trend has begun, referred to as "blue wave 1."
The "Wave Cancel invalid level" is identified as 0.62713. This level serves as a significant reference for risk management. If the market approaches or breaches this level, it might imply potential invalidation of the current wave count, prompting traders to reassess their trading strategies.
In summary, the AUD/USD Elliott Wave Analysis on the daily chart dated 2 November 23, provides essential information for traders. It indicates the initiation of a new impulsive wave (blue wave 1) within the larger wave structure, suggesting an ongoing upward trend. Traders should remain vigilant and use the invalidation level as a critical reference for risk management. This analysis is particularly relevant for traders looking to capitalize on potential trading opportunities in the AUD/USD currency pair.
Technical Analyst: Malik Awais
Source: Tradinglounge.com get trial here