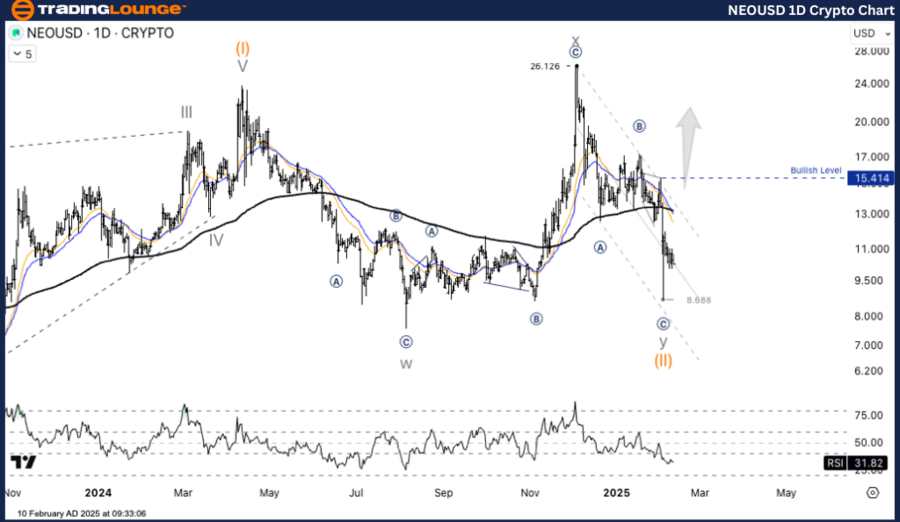
NEOUSD Elliott Wave Analysis - TradingLounge Day Chart

NEO/USD (NEOUSD) Day Chart Analysis

NEOUSD Elliott Wave Technical Analysis

Function: Counter Trend

Mode: Corrective

Structure: Zigzag

Position: Wave ((C))

Next Higher Degree Direction: Wave Y

Wave Cancelation Invalid Level: Not specified

NEO/USD (NEOUSD) Trading Strategy

NEOUSD is in a corrective wave structure that is approaching its conclusion. A breakout above the bullish resistance at $15.414 would indicate the beginning of a new uptrend. However, a decline below the key support at $8.688 could signal a more profound correction. Traders should closely observe price action and market signals before entering trades.

NEOUSD Trading Strategies

Buy Strategy (Long Position):

  • Wait for a break above $15.414 to confirm an uptrend before entering a long position.
  • The primary target is Wave (III), which has the potential for significant upside gains.

Risk Management:

  • A drop below $8.688 would indicate that the correction is still ongoing, increasing the likelihood of further downside movements.

  • Traders should use stop-loss orders and position sizing to manage risks effectively.

NEOUSD-1D-Crypto-Cha...


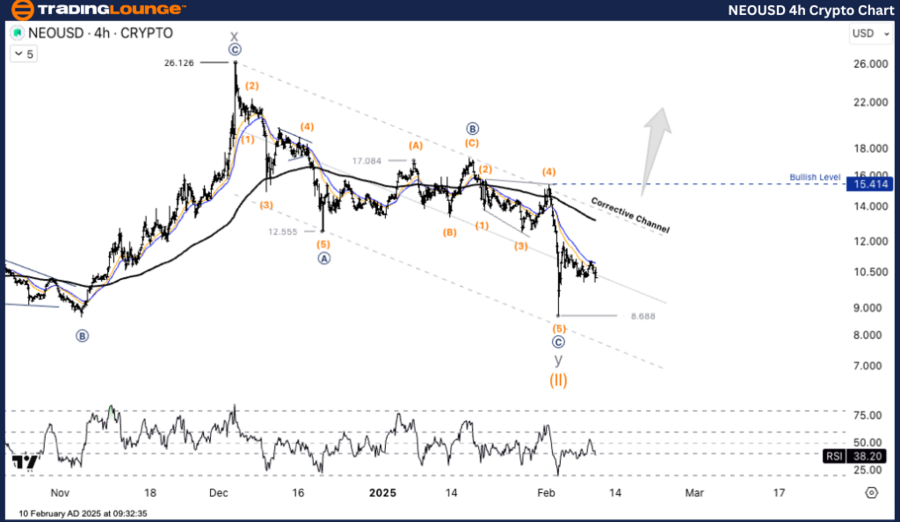
TradingLounge - NEO/USD (NEOUSD) 4-Hour Chart Analysis

NEOUSD Elliott Wave Technical Analysis

Function: Counter Trend

Mode: Corrective

Structure: Zigzag

Position: Wave ((C))

Next Higher Degree Direction: Wave Y

Wave Cancelation Invalid Level: Not specified

NEO/USD (NEOUSD) Trading Strategy

Similar to the day chart analysis, NEOUSD remains in a corrective wave structure that is nearing completion. A break above $15.414 could confirm a new uptrend, while a break below $8.688 would indicate a deeper corrective phase. It is crucial for traders to assess price movement carefully before making any trading decisions.

NEO/USD Trading Strategies

Buy Strategy (Long Position):

  • Enter a long position only after confirmation of an upward breakout above $15.414.
  • The target remains Wave (III), which presents strong potential for upward movement.

Risk Management:

  • If the price drops below $8.688, the corrective wave will likely extend further.

  • Implement a stop-loss strategy to protect against unexpected downturns.

Technical Analyst: Kittiampon Somboonsod

Source: visit Tradinglounge.com and learn From the Experts Join TradingLounge Here 

Previous: XRPUSD Elliott Wave Technical Analysis

VALUE Offer - Buy 1 Month & Get 3 Months!Click here

Access 7 Analysts Over 200 Markets Covered. Chat Room With Support

NEOUSD-4h-Crypto-Cha...

Related

Australian Dollar / Japanese Yen (AUDJPY) Elliott Wave Analysis: Insights into Daily and 4-Hour Chart, Corrective Phase, Wave Patterns

Australian Dollar / Japanese Yen (AUDJPY) Elliott Wave Analysis: Insights into Daily and 4-Hour Chart, Corrective Phase, Wave Patterns

The Australian Dollar to Japanese Yen (AUDJPY) pair is currently in a corrective phase within the El...

Read More >
in-depth Analysis and Trading Strategies S&P/ASX 200 Indices Elliott Wave Technical Analysis

in-depth Analysis and Trading Strategies S&P/ASX 200 Indices Elliott Wave Technical Analysis

Stay ahead in the S&P/ASX 200 market with our in-depth analysis and trading strategies. Our comprehe...

Read More >
Unlocking Commodities Market Opportunities: USD DXY Analysis and Strategic Insights

Unlocking Commodities Market Opportunities: USD DXY Analysis and Strategic Insights

The Commodities Market is on the verge of change as the USD DXY undergoes an Elliott Wave ABC correc...

Read More >
ETF is Positioned for Growth as Clean Energy Investments Gain Momentum: GX Uranium Commodity Elliott Wave Technical Analysis

ETF is Positioned for Growth as Clean Energy Investments Gain Momentum: GX Uranium Commodity Elliott Wave Technical Analysis

The Global X Uranium ETF (GX URA) offers investors exposure to the growing uranium market, fueled by...

Read More >
NVIDIA Corp. (NVDA) Stocks Elliott Wave Technical Analysis Includes NVDA's Wave Counts, Potential Targets, and Resistance Levels

NVIDIA Corp. (NVDA) Stocks Elliott Wave Technical Analysis Includes NVDA's Wave Counts, Potential Targets, and Resistance Levels

This article offers a comprehensive analysis of NVIDIA Corp. (NVDA) using Elliott Wave Theory. We de...

Read More >
Comprehensive Forecast for Silver XAGUSD Commodity Elliott Wave Technical Analysis

Comprehensive Forecast for Silver XAGUSD Commodity Elliott Wave Technical Analysis

This article provides an in-depth Elliott Wave analysis of the silver market for 2024, including pri...

Read More >

Buy 1 Month

Get 3 Months!

Special Offer:

Trade Recommendations

Unleash the power of deversified trading with our comprehensive portfolio, covering:

  • Stock Trades
  • Crypto Trades
  • Forex Trades
  • Commodity Trades
Elliott Wave Analysis

Gain a competive edge with expert insights in to:

  • Global Indices
  • US Stocks & ASX Stocks
  • Forex & Crypto
  • Commodities
Top-Notch Trading Tools

Equip yourself with the tools of success:

  • Social Chat
  • Elliott Wave Algorithm
  • Screener
  • TradingLevels
  • Trading Game
7 Elliott Wave Analysts

Stay ahead of the market with daily charts and insightful videos
-Your secret to strategic trading!

JOIN HERE


Welcome to TradingLounge (ASIC A.R.No. 321187), specialists in trades, trading education and technical analysis, covering stocks, indices, commodities, forex and cryptocurrencies.

When you join TradingLounge you have access to everything we offer, including trade tools, educational content and a social platform to chat with like-minded investors.

Read more

@Copyright 2024 by tradinglounge.com

Contact Us

Australian no: 02 4787 6020

International no: +61 (2) 47876020

Pay with:

Find us on