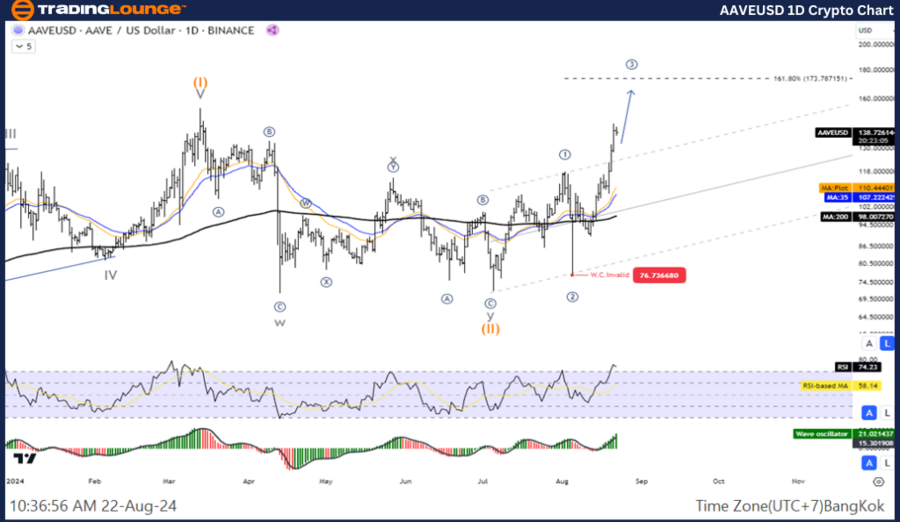
AAVE/USD Elliott Wave Analysis TradingLounge Daily Chart,
AAVE/USD Daily Chart Analysis (AAVEUSD)
AAVEUSD Elliott Wave Technical Analysis
Function: Trend Following
Mode: Motive
Structure: Impulse
Position: Wave (2)
Next Higher Degree Direction: Wave III of Impulse
Wave Invalidation Level: 81.238
Details: Wave (II) appears to have concluded, with prices now likely resuming the upward trend.
AAVE/USD Trading Strategy:
The correction phase seems to be nearing its end. Consider entering the market during a short-term pullback to join the anticipated uptrend.
AAVE/USD Technical Indicators: The price is trading above the MA200, signaling an uptrend. Additionally, the Wave Oscillator shows bullish momentum.

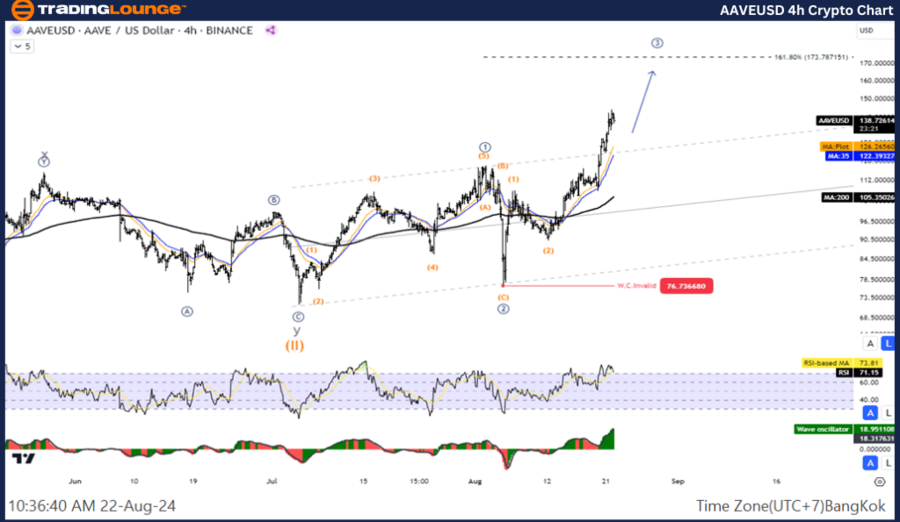
AAVEUSD Elliott Wave Analysis TradingLounge H4 Chart,
AAVE/ U.S. dollar(AAVEUSD) 4-Hour Chart Analysis
AAVEUSD Elliott Wave Technical Analysis
Function: Trend Following
Mode: Motive
Structure: Impulse
Position: Wave (2)
Next Higher Degree Direction: Wave III of Impulse
Wave Invalidation Level: 81.238
Details: Wave (II) likely concluded, suggesting prices are resuming the uptrend.
AAVE/USD Trading Strategy:
The market remains in a correction phase. Currently, in wave (II) with a double corrective pattern, expect a short-term pullback before a rise in wave (III). Wait for the correction to finish before rejoining the uptrend.
Technical Indicators: The price is above the MA200, indicating an uptrend, with the Wave Oscillator reflecting bullish momentum.
Technical Analyst: Kittiampon Somboonsod
Source: visit Tradinglounge.com and learn From the Experts Join TradingLounge Here
See Previous: XRPUSD Elliott Wave Technical Analysis
Special Trial Offer - 0.76 Cents a Day for 3 Months! Click here
Access 7 Analysts Over 200 Markets Covered. Chat Room With Support
