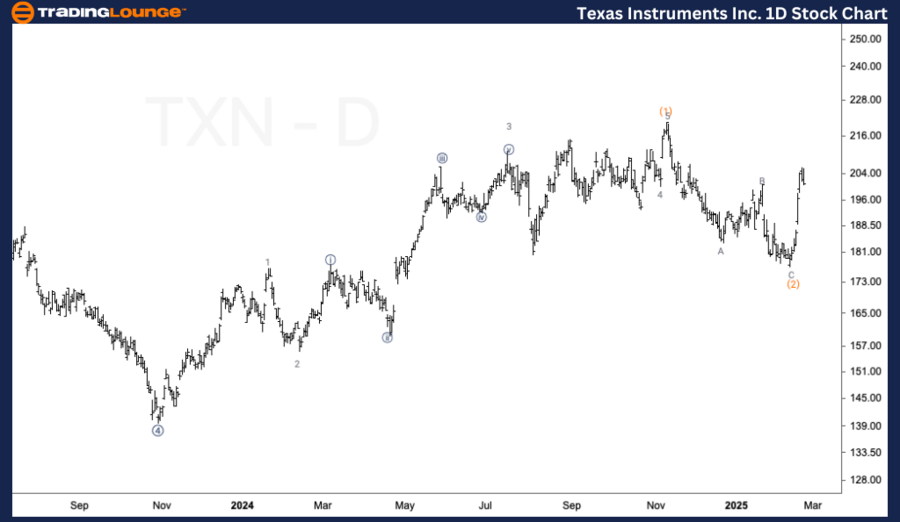
Texas Instruments (TXN) Elliott Wave Analysis – Trading Lounge Daily Chart
TXN Elliott Wave Technical Analysis
Function: Trend
Mode: Impulsive
Structure: Motive
Position: Wave (3) of 5
Direction: Upside in wave (3)
Details:
Texas Instruments (TXN) continues its upward trajectory within Primary Wave 5, maintaining a strong impulsive trend after experiencing its most substantial correction since late 2023. The stock's current bullish momentum in wave (3) suggests further potential for upside movement, reinforcing the prevailing uptrend.
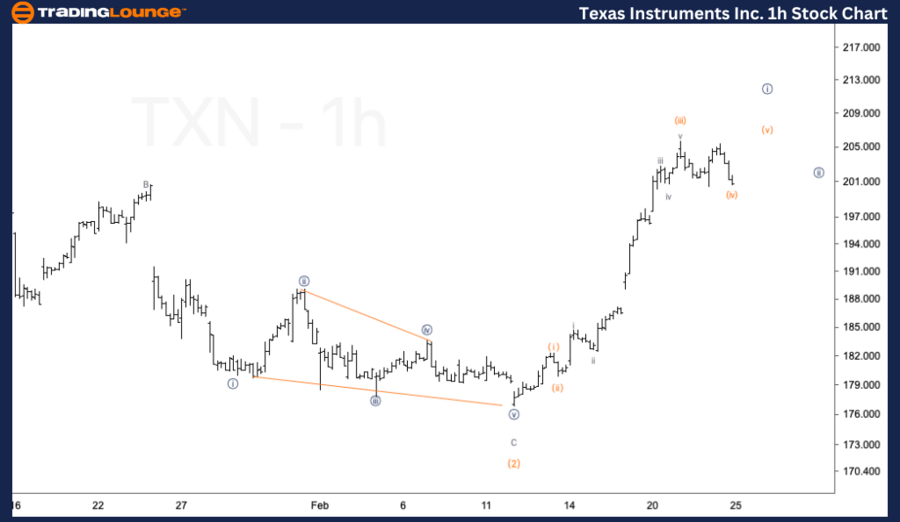
Texas Instruments (TXN) Elliott Wave Analysis – Trading Lounge 1-Hour Chart
TXN Elliott Wave Technical Analysis
Function: Trend
Mode: Impulsive
Structure: Motive
Position: Wave {i} of 1
Direction: Top in wave {i}
Details:
The recent uptrend from the $176 low appears to be entering a corrective phase near the $200 level. We anticipate a pullback toward $200 as part of wave {ii}, after which the bullish trend is expected to resume, driving the next leg higher.
Technical Analyst: Alessio Barretta
Source: visit Tradinglounge.com and learn From the Experts Join TradingLounge Here
See Previous: Berkshire Hathaway Inc Elliott Wave Technical Analysis
VALUE Offer - Buy 1 Month & Get 3 Months!Click here
Access 7 Analysts Over 200 Markets Covered. Chat Room With Support