Natural Gas Analysis: Elliott Wave Perspective
Mode: Larger degree bullish correction
Structure: Impulse wave C (circled) of Flat
Position: Wave (4)
Direction: Wave (4) is still in play
Details: The price is currently correcting lower in wave (4). Alternatively, this might be the 2nd wave of an extended wave 5 of (3). More price data is needed to confirm this, but the former scenario is more likely.
Since late February 2024, natural gas has rebounded over 80% after hitting its lowest price since mid-2020. The commodity is poised to continue higher, potentially reaching new highs not seen since 2023. However, in the long term, this recovery could be part of the retracement of the bearish trend that began in October 2022, when prices were around $10.
Natural Gas Daily Chart Analysis
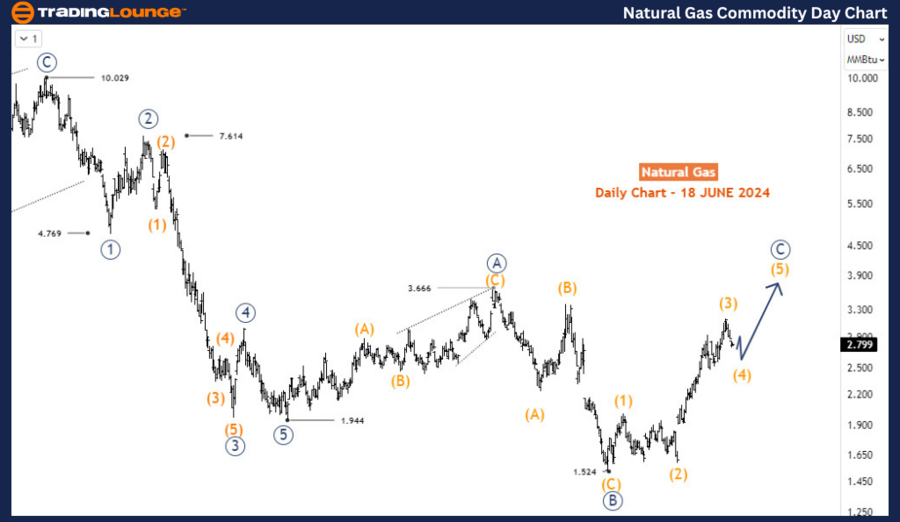
On the daily chart, a bearish impulse wave started at $10.029 in August 2022 and completed at $1.944 in April 2023. Following a bearish impulse, a bullish correction typically ensues, which is what the current price action represents. The pattern emerging is an irregular flat correction. Wave A and B (circled) concluded at $3.666 and $1.524 respectively. The price is now advancing in an impulse structure corresponding to wave C (circled). Wave C might terminate near $3.666 or possibly breach it. The impulse structure from $1.524 is crucial in determining the completion point of the corrective phase from $1.944.

Natural Gas H4 Chart Analysis
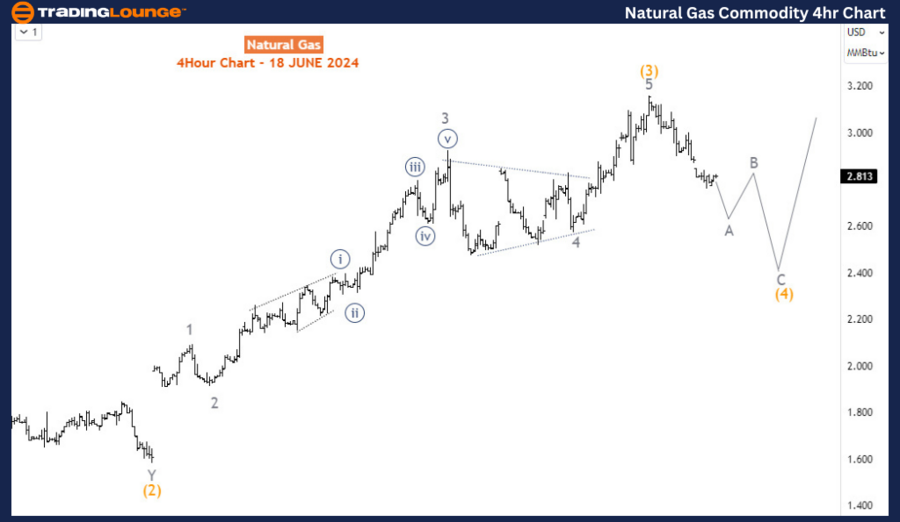
On the H4 chart, the impulse for wave C (circled) has completed the first three sub-waves, i.e., waves (1), (2), and (3) of the intermediate degree. The 4th wave is emerging downwards, potentially forming a zigzag structure based on its initial appearance. It appears that wave A of (C) is still ongoing, indicating that wave (4) has not yet completed. The corrective decline could extend to the Fibonacci zone between $2.56 and $2.37 before wave (5), which has the potential to reach or even exceed the $3.666 high from October 2023, starts.
Technical Analyst: Sanmi Adeagbo
Source: visit Tradinglounge.com and learn From the Experts Join TradingLounge Here
See Previous: Wheat Elliott Wave Technical Analysis
Special Trial Offer - 0.76 Cents a Day for 3 Months! Click here
Access 7 Analysts Over 170 Markets Covered. Chat Room With Support

Summary
Natural gas has seen a significant recovery since late February 2024, bouncing back over 80% from its mid-2020 low. This recovery is likely a part of the retracement of the bearish trend from October 2022.
On the daily chart, a bearish impulse wave concluded in April 2023, followed by an upward correction that seems to be forming an irregular flat pattern. Wave A and B have ended, and wave C is advancing. The impulse structure from $1.524 will be critical in determining the completion of the corrective phase.
On the H4 chart, the impulse for wave C has completed the first three sub-waves, with wave (4) now developing. The corrective decline might continue to the Fibonacci zone of $2.56 to $2.37 before wave (5) begins, potentially reaching or surpassing the $3.666 high from October 2023. Traders should monitor these key levels to anticipate the next phase of the bullish correction.