WTI Crude Oil Commodity Elliott Wave Analysis

WTI Crude has shown gains in August 2024 following a sell-off in July, although it has been trading within a range since March 2023. The current rally may encounter resistance below $85, potentially prompting sellers to step in again.

WTI Elliott Wave Technical Analysis: Long-Term Outlook

In the long term, WTI Crude remains in a corrective phase, retracing the bullish impulse that occurred between April 2020 and March 2022. This correction seems to be forming a double zigzag pattern, labeled as waves W-X-Y of the primary degree. Wave W (circled) completed in March 2023 with a zigzag structure, after which the price has moved sideways without a clear breakout. From an Elliott Wave perspective, this sideways movement appears to be forming a triangle pattern for wave X (circled).

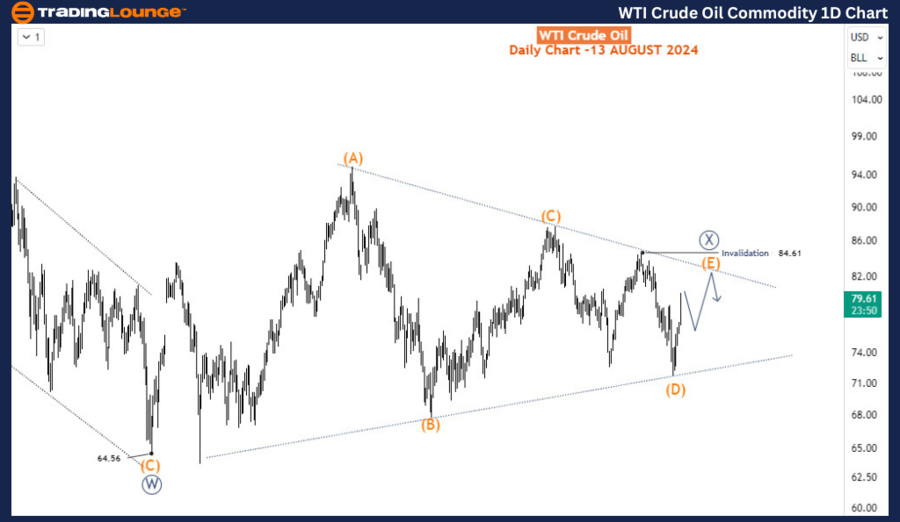
Daily Chart Analysis

On the daily chart, WTI has completed waves A, (B), (C), and (D) of wave X (circled). The ongoing rally from the August 2024 low is likely part of wave (E), expected to complete wave X (circled). Wave (E) is anticipated to finish as a corrective structure, most likely in a zigzag pattern.
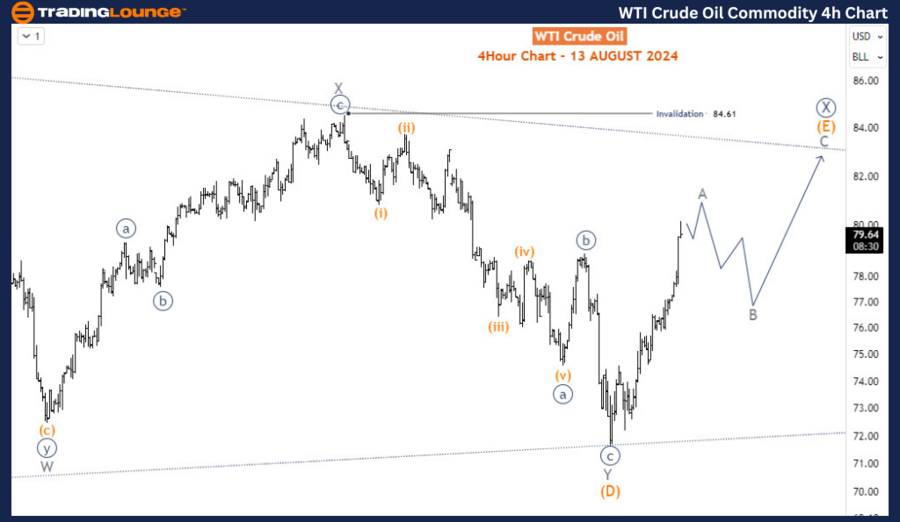
WTI-Crude-Oil-Commod...


H4 Chart Analysis

The H4 chart indicates that the current rally is clearly an impulse wave, labeled as wave A of (E). Once wave A concludes, a pullback for wave B is expected, followed by further rallies to complete wave C of (E). As long as the 84.6 invalidation level remains unbreached, the long-term outlook stays bearish. However, the short-term rally is likely to continue.

Conclusion

WTI Crude is currently in a short-term rally that may face resistance below $85. Although the broader outlook remains bearish, this rally is expected to complete wave (E) of X (circled) before the market resumes its downward trend. Traders should monitor for a pullback after wave A concludes, as this could present opportunities for short-term gains before the larger downtrend continues.

Technical Analyst: Sanmi Adeagbo

Source: visit Tradinglounge.com and learn From the Experts Join TradingLounge Here 

See Previous: Silver Elliott Wave Technical Analysis

Special Trial Offer - 0.76 Cents a Day for 3 Months! Click here

Access 7 Analysts Over 170 Markets Covered. Chat Room With Support

WTI-Crude-Oil-Commod...

Related

Trading Strategies to Navigate the Polkadot Cryptocurrency Market Confidently With DOTUSD Elliott Wave Technical Analysis

Trading Strategies to Navigate the Polkadot Cryptocurrency Market Confidently With DOTUSD Elliott Wave Technical Analysis

This comprehensive analysis of DOTUSD provides insights into Polkadot's price trends using Ellio...

Read More >
Asx Stock Unibail Rodamco Westfield URW Elliott Wave Technical Forecast: Offers a Clear Outlook on Price Trends and Potential Movements

Asx Stock Unibail Rodamco Westfield URW Elliott Wave Technical Forecast: Offers a Clear Outlook on Price Trends and Potential Movements

Our in-depth Elliott Wave analysis for ASX: UNIBAIL RODAMCO WESTFIELD (URW) offers a clear outlook o...

Read More >
Elliott Wave Trading Strategies: Top Market Analysis for SP500, NASDAQ & Tech Stocks

Elliott Wave Trading Strategies: Top Market Analysis for SP500, NASDAQ & Tech Stocks

Expert Elliott Wave analysis is provided for top markets including the SP500, NASDAQ 100, major tech...

Read More >
Expert Tips on Navigating the Market's Bullish and Bearish Signals: Bovespa Index Elliott Wave Technical Analysis

Expert Tips on Navigating the Market's Bullish and Bearish Signals: Bovespa Index Elliott Wave Technical Analysis

This article provides an in-depth Bovespa Index analysis, focusing on Elliott Wave strategies, marke...

Read More >
Examines the Commodity market's corrective wave structures for Iron Ore Elliott Wave Technical Analysis

Examines the Commodity market's corrective wave structures for Iron Ore Elliott Wave Technical Analysis

This article provides an in-depth Elliott Wave analysis of the iron ore market, focusing on current ...

Read More >
Neo/ U.S. dollar(NEOUSD) Elliott Wave Technical Analysis 16 November 23

Neo/ U.S. dollar(NEOUSD) Elliott Wave Technical Analysis 16 November 23

Neo/ U.S. dollar(NEOUSD) Elliott Wave Technical Analysis 16 November 23 offers an in-depth perspecti...

Read More >

Buy 1 Month

Get 3 Months!

Special Offer:

Trade Recommendations

Unleash the power of deversified trading with our comprehensive portfolio, covering:

  • Stock Trades
  • Crypto Trades
  • Forex Trades
  • Commodity Trades
Elliott Wave Analysis

Gain a competive edge with expert insights in to:

  • Global Indices
  • US Stocks & ASX Stocks
  • Forex & Crypto
  • Commodities
Top-Notch Trading Tools

Equip yourself with the tools of success:

  • Social Chat
  • Elliott Wave Algorithm
  • Screener
  • TradingLevels
  • Trading Game
7 Elliott Wave Analysts

Stay ahead of the market with daily charts and insightful videos
-Your secret to strategic trading!

JOIN HERE


Welcome to TradingLounge (ASIC A.R.No. 321187), specialists in trades, trading education and technical analysis, covering stocks, indices, commodities, forex and cryptocurrencies.

When you join TradingLounge you have access to everything we offer, including trade tools, educational content and a social platform to chat with like-minded investors.

Read more

@Copyright 2024 by tradinglounge.com

Contact Us

Australian no: 02 4787 6020

International no: +61 (2) 47876020

Pay with:

Find us on