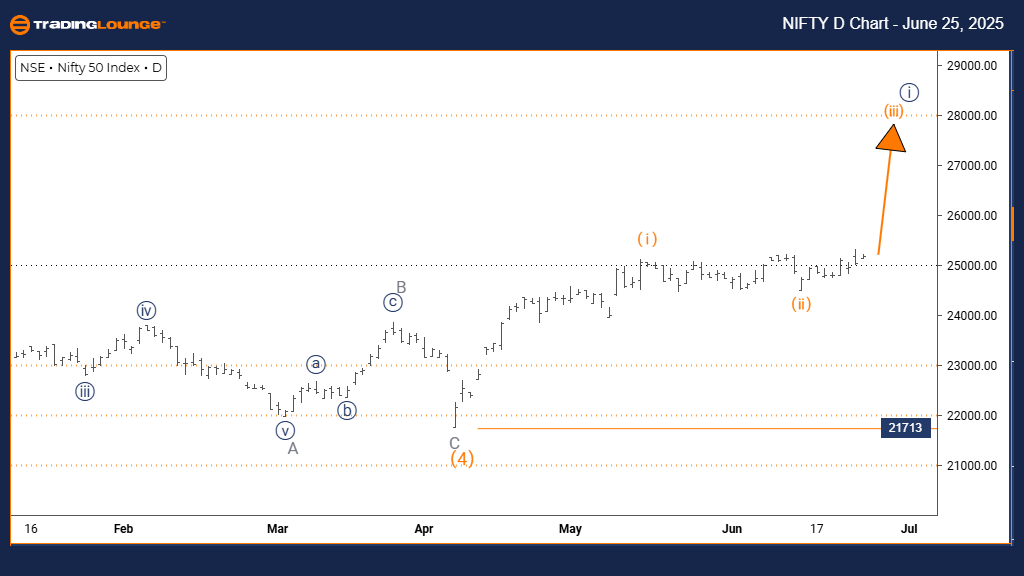
NIFTY 50 INDEX Elliott Wave Analysis – Trading Lounge Day Chart
NIFTY 50 INDEX Wave Technical Analysis
FUNCTION: Trend
MODE: Impulsive
STRUCTURE: Orange Wave 3
POSITION: Navy Blue Wave 1
DIRECTION NEXT HIGHER DEGREES: Orange Wave 3 (ongoing)
DETAILS: Orange Wave 2 likely completed. Orange Wave 3 now active.
Wave Cancel Invalid Level: 21779
The NIFTY 50 INDEX daily chart highlights a bullish Elliott Wave trend, signaling a strong upward momentum. The market is currently forming Orange Wave 3, part of the larger Navy Blue Wave 1 pattern, indicating continued growth potential.
Analysis shows Orange Wave 2 has ended its correction phase, and Orange Wave 3 has started. This wave typically leads to sharp price increases due to its impulsive nature. Traders should watch the progress of Orange Wave 3 for further bullish movement.
Key support lies at 21779. A drop below this level would invalidate the current Elliott Wave count, requiring a fresh analysis. As long as price holds above this level, the bullish outlook remains intact.
In summary, NIFTY 50 INDEX shows clear potential for upward movement, driven by the start of Orange Wave 3. This signals strong buying activity and likely continuation of the uptrend.
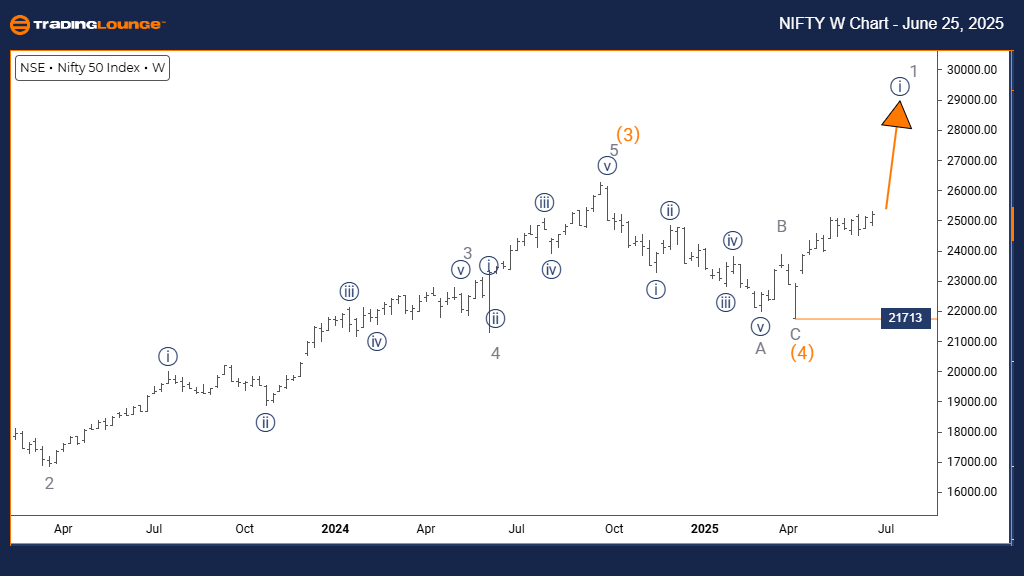
NIFTY 50 INDEX Elliott Wave Analysis – Trading Lounge Weekly Chart
NIFTY 50 INDEX Wave Technical Analysis
FUNCTION: Bullish Trend
MODE: Impulsive
STRUCTURE: Navy Blue Wave 1
POSITION: Gray Wave 1
DIRECTION NEXT LOWER DEGREES: Navy Blue Wave 2
DETAILS: Orange Wave 4 likely complete. Navy Blue Wave 1 of 1 is in motion.
Wave Cancel Invalid Level: 21779
The weekly Elliott Wave outlook for NIFTY 50 INDEX supports a long-term bullish trend. Price action remains impulsive, reflecting robust upward momentum. The chart identifies the active wave as Orange Wave 3, which belongs to the broader Navy Blue Wave 1 pattern.
With the correction phase of Orange Wave 2 complete, Orange Wave 3 has started to unfold. Historically, this is the most dynamic segment, often leading to strong gains. Monitoring the evolution of this wave is critical for traders looking to align with the market trend.
The level to watch is 21779. A move below this point will challenge the current bullish wave structure. Otherwise, the market is expected to continue trending higher.
Overall, the technical forecast for NIFTY 50 INDEX remains positive. As Orange Wave 3 progresses beyond Orange Wave 2, the impulsive move signals ongoing buying interest and the possibility of significant upside in the near term.
Technical Analyst: Malik Awais
Source: Visit Tradinglounge.com and learn from the Experts. Join TradingLounge Here
Previous: KOSPI Index Elliott Wave Technical Analysis
VALUE Offer - Buy 1 Month & Get 3 Months!Click here
Access 7 Analysts Over 200 Markets Covered. Chat Room With Support