27May

Car Group Limited (ASX:CAR) Elliott Wave Forecast Shows Bullish Outlook with Support Level at 34.15 Confirming Wave Completion

ASX: CAR GROUP LIMITED (CAR) Elliott Wave Technical Analysis – TradingLounge

Greetings,

This updated Elliott Wave analysis for CAR GROUP LIMITED (ASX:CAR), listed on the Australian Securities Exchange, identifies a key technical development. Our recent evaluation suggests that CAR has likely completed a corrective phase, specifically Wave (4) - orange, forming a classic Zigzag pattern. This signals potential bullish momentum, indicating that a new upward trend may be developing. This technical summary includes a market forecast and a critical invalidation level to monitor for trend confirmation.

ASX: CAR GROUP LIMITED (CAR) Elliott Wave Analysis – Daily Chart

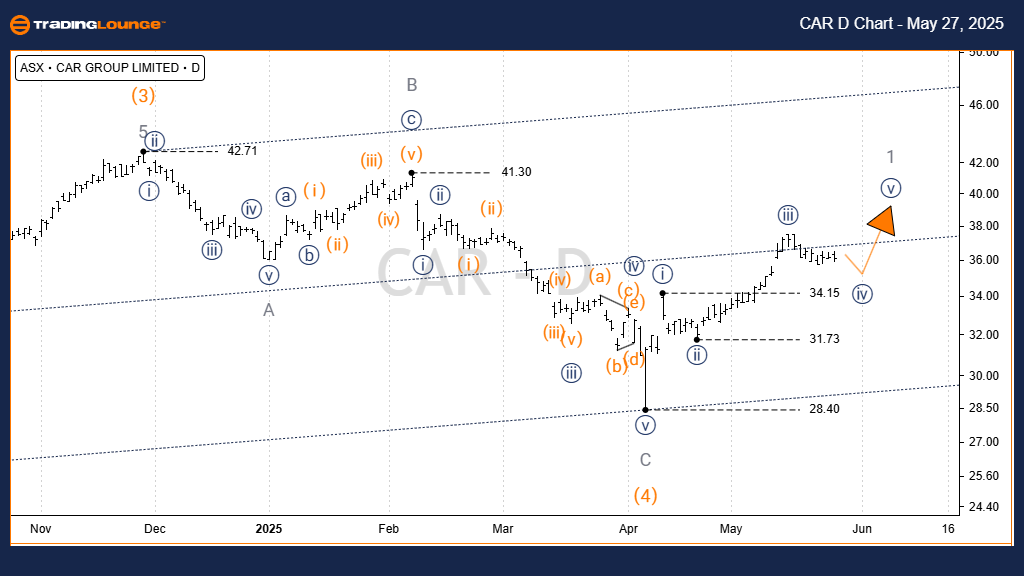
ASX: CAR GROUP LIMITED (CAR) Daily Chart (Semilog Scale) Analysis

Trend Type: Intermediate

Wave Mode: Motive

Structure: Impulse

Current Wave: Wave iv)) - navy within Wave 1 - grey of Wave (5) - orange

Key Technical Insights:

  • Wave (4) - orange began near the 42.71 level and likely concluded at 28.40, forming an A-B-C Zigzag (grey).
  • The C wave (grey) consists of five well-defined subwaves, indicating potential wave completion.
  • Current action suggests Wave (5) - orange is now underway.

The market appears to be in a minor retracement via Wave iv)) - navy, which has not broken below Wave i)) - navy — a sign of sustained upward potential through Wave v)) - navy.

Critical Support / Invalidation Level: 34.15 (A break below this level would challenge the current wave interpretation.)

CAR-Day-asx-stock-ch...


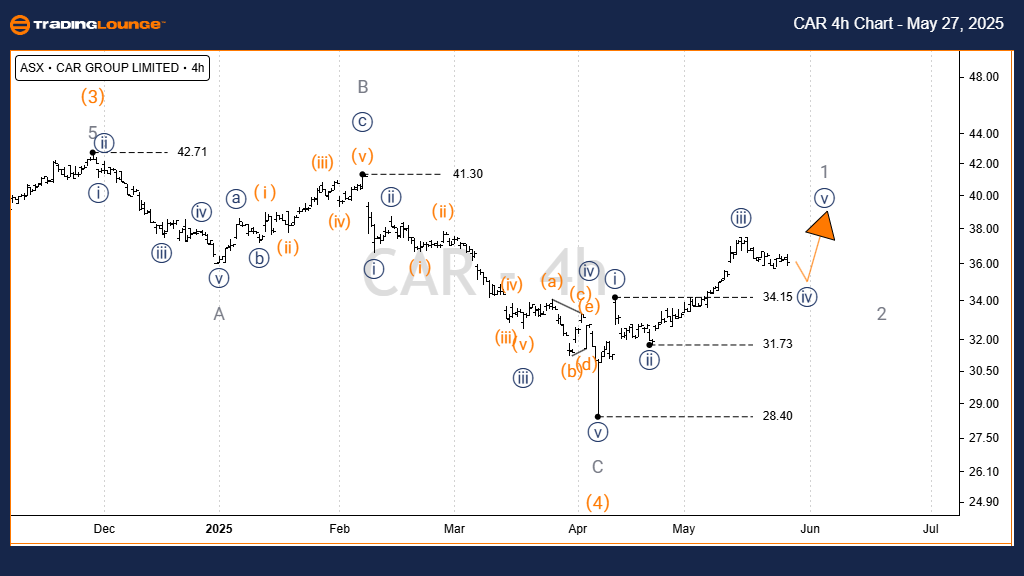
ASX: CAR GROUP LIMITED (CAR) Elliott Wave Technical Analysis – 4-Hour Chart

Trend Type: Minor

Wave Mode: Motive

Structure: Impulse

Current Wave: Wave ((iv)) - navy within Wave 1 - grey of Wave (5) - orange

Technical Breakdown:

  • The intraday pattern confirms alignment with the daily chart’s wave structure.
  • Wave iv)) - navy continues to unfold with typical corrective behavior.
  • No invalid overlap has occurred, supporting the ongoing bullish scenario.

Reinforced Invalidation Level: 34.15 (Consistent with the daily chart’s key support level.)

Technical Analyst: Hua (Shane) Cuong, CEWA-M (Master’s Designation).

Source: Visit Tradinglounge.com and learn from the Experts. Join TradingLounge Here 

See Previous: IAG Elliott Wave Technical Analysis

VALUE Offer - Buy 1 Month & Get 3 Months!Click here

Access 7 Analysts Over 200 Markets Covered. Chat Room With Support

CAR-4h-asx-stock-cha...


Conclusion:

This Elliott Wave forecast for ASX: CAR GROUP LIMITED (ASX:CAR) highlights a potentially bullish development based on a completed Wave (4) Zigzag correction. By identifying precise wave counts and key price thresholds, this analysis aids traders in making more informed strategic decisions. As long as prices remain above 34.15, the bullish wave scenario remains intact. Stay tuned for future updates to confirm progress through Wave v)) - navy.

Related

Elliott Wave Analysis Predicts CAR Group Limited Stock Rally, ASX: CAR Technical Forecast with Wave 5 Setup and Key Levels

Elliott Wave Analysis Predicts CAR Group Limited Stock Rally, ASX: CAR Technical Forecast with Wave 5 Setup and Key Levels

CAR Group Limited (ASX: CAR) technical overview provides an in-depth Elliott Wave analysis, covering...

Read More >
GX Uranium ETF Elliott Wave Technical Analysis: Price Prediction, and Investment Opportunities in the Uranium Sector

GX Uranium ETF Elliott Wave Technical Analysis: Price Prediction, and Investment Opportunities in the Uranium Sector

GX Uranium ETF with the detailed Elliott Wave analysis. Understand key support levels, market trends...

Read More >
Uncover key validation points to boost your trading confidence: ASX Limited Elliott Wave Technical Analysis

Uncover key validation points to boost your trading confidence: ASX Limited Elliott Wave Technical Analysis

Our comprehensive Elliott Wave analysis provides an in-depth look at ASX LIMITED on the Australian S...

Read More >
Nikkei 225 (N225) Elliott Wave Forecast Shows Bullish Wave 3 Structure with Strong Uptrend Signals Across Daily and Weekly Charts

Nikkei 225 (N225) Elliott Wave Forecast Shows Bullish Wave 3 Structure with Strong Uptrend Signals Across Daily and Weekly Charts

Nikkei 225 reveals a strong bullish trend with impulsive wave formations on both daily and weekly ch...

Read More >
NEWMONT CORPORATION - NEM Stock Analysis & Elliott Wave Technical Forecast, Price Targets, & Trading Strategy

NEWMONT CORPORATION - NEM Stock Analysis & Elliott Wave Technical Forecast, Price Targets, & Trading Strategy

Newmont Corporation (ASX:NEM) advances in a strong wave three. Get key Elliott Wave targets, critica...

Read More >

Buy 1 Month

Get 3 Months!

Special Offer:

Trade Recommendations

Unleash the power of deversified trading with our comprehensive portfolio, covering:

  • Stock Trades
  • Crypto Trades
  • Forex Trades
  • Commodity Trades
Elliott Wave Analysis

Gain a competive edge with expert insights in to:

  • Global Indices
  • US Stocks & ASX Stocks
  • Forex & Crypto
  • Commodities
Top-Notch Trading Tools

Equip yourself with the tools of success:

  • Social Chat
  • Elliott Wave Algorithm
  • Screener
  • TradingLevels
  • Trading Game
7 Elliott Wave Analysts

Stay ahead of the market with daily charts and insightful videos
-Your secret to strategic trading!

JOIN HERE


Welcome to TradingLounge (ASIC A.R.No. 321187), specialists in trades, trading education and technical analysis, covering stocks, indices, commodities, forex and cryptocurrencies.

When you join TradingLounge you have access to everything we offer, including trade tools, educational content and a social platform to chat with like-minded investors.

Read more

@Copyright 2024 by tradinglounge.com

Contact Us

Australian no: 02 4787 6020

International no: +61 (2) 47876020

Pay with:

Find us on