NTPC – NTPC Elliott Wave Analysis TradingLounge (1D Chart)
NTPC Day Chart Analysis
NTPC Elliott Wave Technical Analysis
Function: Larger Trend Higher (Intermediate Degree Wave (5), Orange)
Mode: Motive
Structure: Impulse
Position: Minute Wave ((v)) Navy
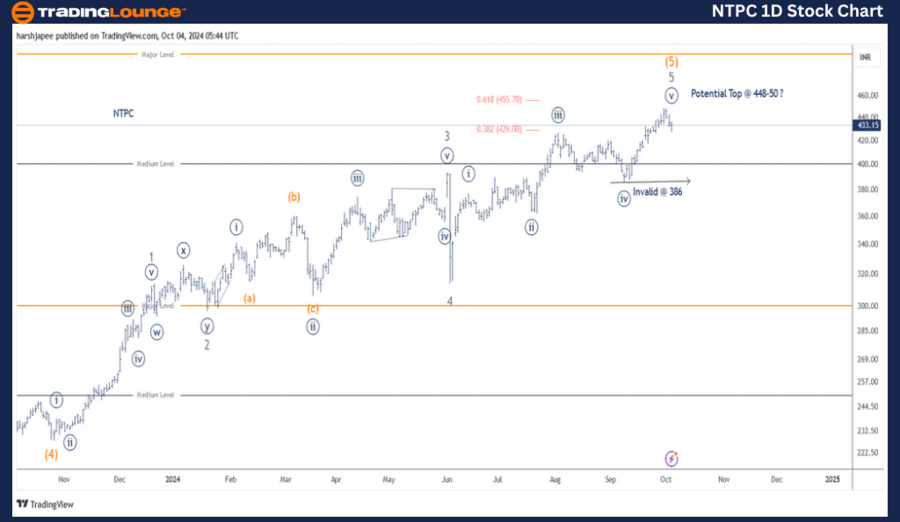
Details: Minute Wave ((v)) Navy is progressing higher toward 455, within Minor Wave 5 of Intermediate Wave (5) Orange. Alternatively, Wave 5 could be complete around the 448-450 levels. Traders may consider tightening their risk to 386.
Invalidation Point: 386
NTPC Daily Chart Technical Analysis and Potential Elliott Wave Counts:
The NTPC daily chart suggests a potential termination of Intermediate Wave (5) Orange around the 448-450 levels. The stock has pulled back from recent highs and is trading around the 430 level at the time of writing. A break below 386 would confirm the formation of a major top.
NTPC has seen a significant rise since October 2023, when it bottomed around the 220-225 range, which is marked as Intermediate Wave (4) Orange. Minor Waves 1 through 5 also appear complete, with Wave 2 unfolding as a combination and Wave 4 experiencing a sharp decline to 314 on June 04, 2024.
If the current NTPC Elliott Wave counts are correct, the stock should remain below 448 and continue to move lower toward 386 in the near term. Alternatively, Minute Wave ((v)) Navy could push further toward the 455-460 range before completion.
NTPC – NTPC Elliott Wave Technical Analysis (4H Chart)
Function: Larger Trend Higher (Intermediate Degree Wave (5), Orange)
Mode: Motive
Structure: Impulse
Position: Minute Wave ((v)) Navy
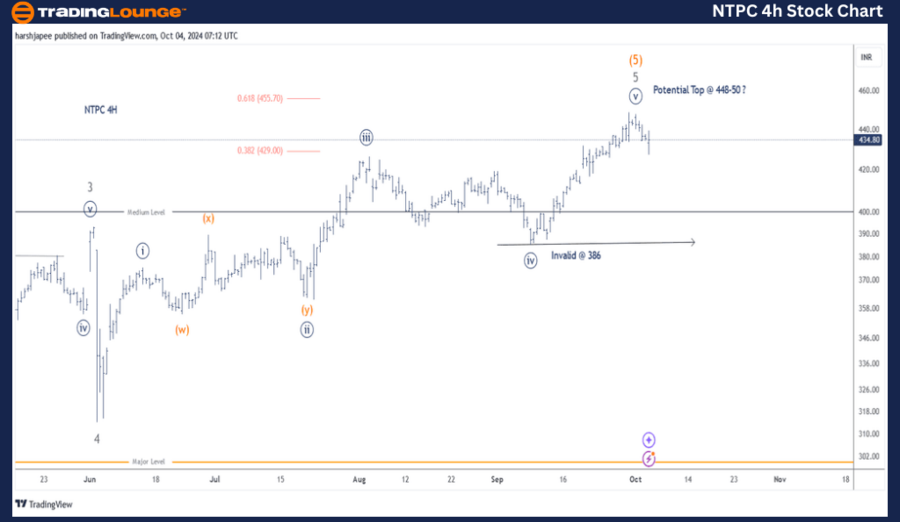
Details: Minute Wave ((v)) Navy is progressing higher toward 455, within Minor Wave 5 of Intermediate Wave (5) Orange. Alternatively, Wave 5 could terminate around 448-450, just shy of the Fibonacci 0.618 extension at 455.
Invalidation Point: 386
NTPC 4H Chart Technical Analysis and Potential Elliott Wave Counts:
The NTPC Elliott Wave counts on the 4H chart indicate a five-wave rally between the 314 and 448 levels, terminating Minute Wave ((v)) of Minor Wave 5. If this count holds, the stock is expected to break below 386, which represents Minute Wave ((iv)) as marked.
Technical Analyst: Harsh Japee
Source: visit Tradinglounge.com and learn From the Experts Join TradingLounge Here
Previous: Bharat Electricals Elliott Wave Technical Analysis
VALUE Offer - Buy 1 Month & Get 3 Months!Click here
Access 7 Analysts Over 200 Markets Covered. Chat Room With Support
Conclusion:
NTPC might have formed a major top around the 448 level as the fifth wave terminates across multiple degrees: Minute, Minor, and Intermediate. Alternatively, the stock could push through to the 455-460 levels before reversing lower.