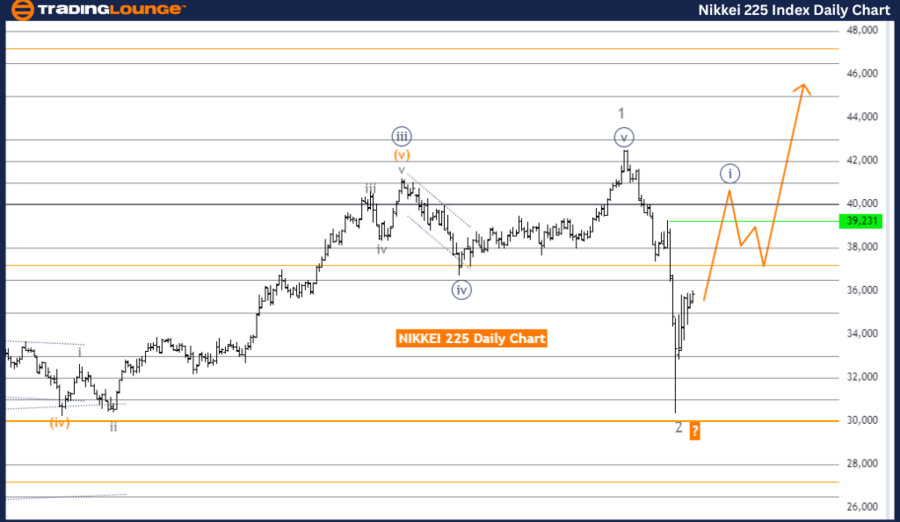
NIKKEI 225 (N225) Elliott Wave Analysis Trading Lounge Day Chart
NIKKEI 225 (N225) Day Chart Analysis
NIKKEI 225 (N225) Elliott Wave Technical Analysis
Function: Trend
Mode: Impulsive
Structure: Navy Blue Wave 1
Position: Gray Wave 3
Direction Next Lower Degrees: Navy Blue Wave 2
Details: Gray Wave 2 appears complete, with Navy Blue Wave 1 currently unfolding.
Wave Cancel Invalid Level: 30,308
The NIKKEI 225 Elliott Wave Analysis on the daily chart focuses on the ongoing market trend, which is classified as impulsive. The current structure involves Navy Blue Wave 1, which is actively developing. This wave is a component of the larger Gray Wave 3, signaling strong upward momentum within this wave sequence.
Prior to the emergence of Navy Blue Wave 1, Gray Wave 2—a corrective phase—seems to have concluded. With Gray Wave 2 considered complete, the market has transitioned into the impulsive Navy Blue Wave 1. This shift indicates the beginning of a new upward phase, suggesting a continuation of the broader upward trend within the NIKKEI 225 index.
As the market progresses within Navy Blue Wave 1, the next expected phase is Navy Blue Wave 2, which will likely bring a corrective movement following the current impulsive phase. However, the primary focus remains on the formation and completion of Navy Blue Wave 1, which is currently driving the market upwards.
A crucial level to monitor in this wave analysis is the wave cancel invalid level, set at 30,308. This threshold is vital, as a drop below it would invalidate the current Elliott Wave count. If the market falls below this level, it could suggest that the anticipated upward movement within Navy Blue Wave 1 may not unfold as expected, potentially indicating a shift in market direction.
In summary, the NIKKEI 225 Elliott Wave Analysis on the daily chart indicates that the market is in an impulsive phase within Navy Blue Wave 1, following the completion of Gray Wave 2. The analysis suggests continued upward movement, with the invalidation level at 30,308 being crucial for confirming the ongoing wave structure.
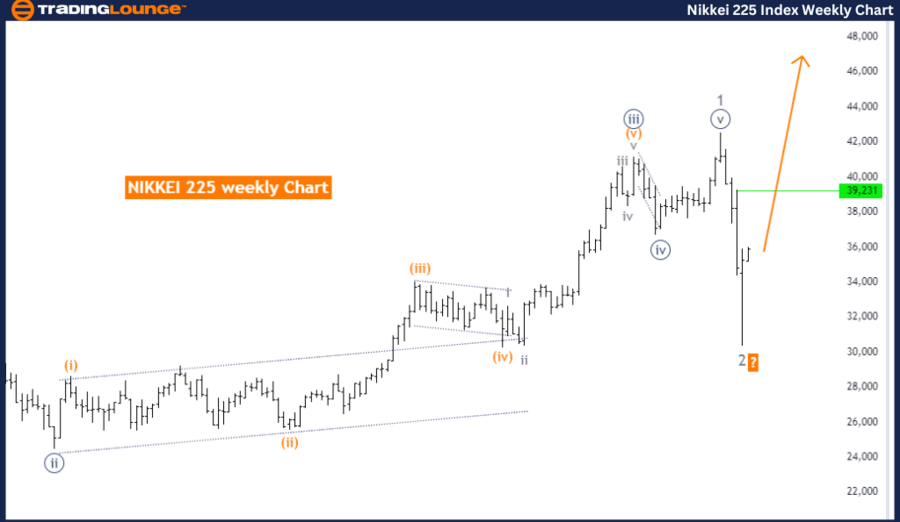
NIKKEI 225 (N225) Elliott Wave Analysis Trading Lounge Weekly Chart
NIKKEI 225 (N225) Elliott Wave Technical Analysis
Function: Trend
Mode: Impulsive
Structure: Gray Wave 3
Direction Next Higher Degrees: Gray Wave 3 (Started)
Details: Gray Wave 2 appears complete, with Gray Wave 3 now in progress.
Wave Cancel Invalid Level: 30,308
The NIKKEI 225 Elliott Wave Analysis on the weekly chart highlights a strong upward trend currently underway. The market is described as impulsive, indicating a clear and sustained movement, specifically within the structure of Gray Wave 3. This wave represents a significant phase of market activity that is contributing to the overall upward trend.
Before this current wave, the market completed Gray Wave 2, a corrective phase that offered a temporary pullback in the market’s trajectory. With Gray Wave 2 now considered complete, the focus has shifted to Gray Wave 3, which has begun and is driving the market higher. This suggests that the market is now in a powerful and potentially enduring phase of upward momentum.
As Gray Wave 3 advances, it marks an important stage in the Elliott Wave cycle, with expectations for continued upward movement. This wave represents the continuation of the broader trend, implying that the market is likely to experience further gains as this wave develops.
The analysis points to a critical invalidation level at 30,308. This level is crucial because if the market falls below this point, it would invalidate the current Elliott Wave count. Such a move would imply that the expected upward trend within Gray Wave 3 might not proceed as anticipated, potentially signaling a shift in market direction.
In summary, the NIKKEI 225 Elliott Wave Analysis on the weekly chart suggests that the market is currently in an impulsive Gray Wave 3, following the completion of Gray Wave 2. The analysis indicates that the upward trend is likely to continue, with the invalidation level at 30,308 being a key point to monitor for confirming the ongoing wave structure.
Technical Analyst: Malik Awais
Source: visit Tradinglounge.com and learn From the Experts Join TradingLounge Here
See previous: NASDAQ Index Elliott Wave Technical Analysis
Special Trial Offer - 0.76 Cents a Day for 3 Months! Click here
Access 7 Analysts Over 170 Markets Covered. Chat Room With Support