Corn Elliott Wave Technical  Analysis

Corn prices have rebounded significantly, rising about 14% since the low in late August 2024. This upward move represents a corrective phase within the broader downtrend that began in May 2024. While the short-term outlook indicates potential further gains, the medium-term forecast remains bearish, with prices likely to drop below $475.

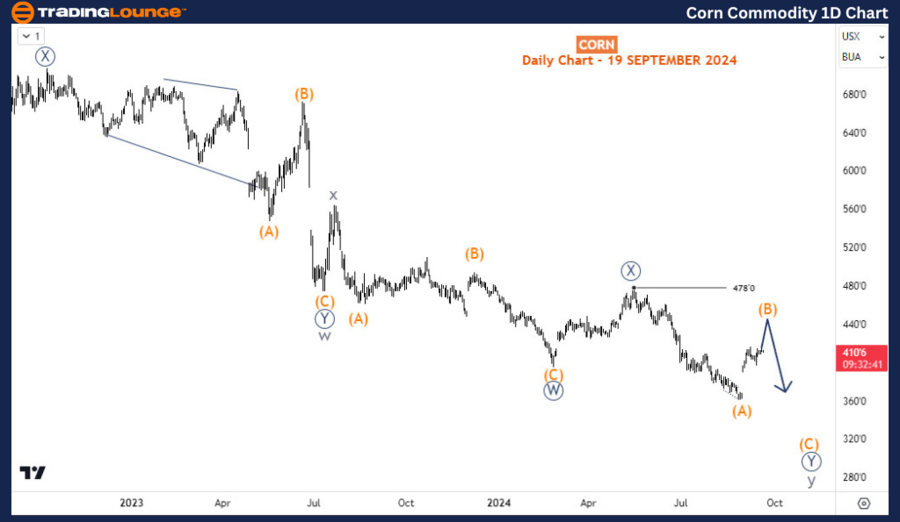
TradingLounge Corn Commodity Daily Chart Analysis

The dominant bearish trend for corn started in April 2022. This decline appears corrective rather than impulsive, suggesting a complex wave structure. Without an impulsive recovery, the current upward movement is expected to be temporary, with a likely reversal ahead. A closer look at the price action since the April 2022 high reveals a double zigzag pattern at the cycle degree. The fall from $475 is identified as an impulse wave, forming wave (A) of Y (circled) within the broader cycle wave y. The ongoing rise is classified as wave (B) of Y (circled), and it is critical that this wave caps below $478 to confirm the current Elliott Wave count.

Corn-Commodity-1D-Ch...


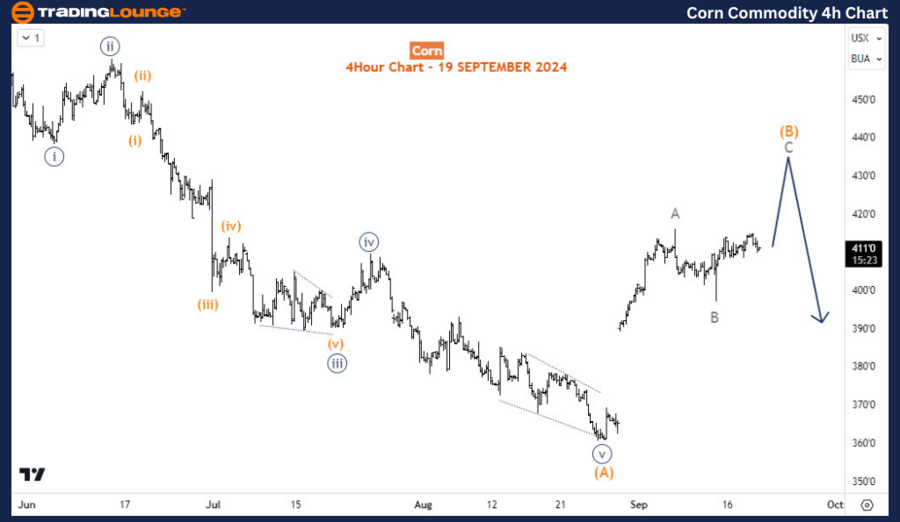
TradingLounge Corn Commodity H4 Chart Analysis

In the H4 chart, the recent rise appears to have completed wave A of (B). The confirmation of wave B’s completion will occur if the price breaks above the wave A high. If this break happens, wave C of (B) may target the $450 level. Despite this short-term correction, it’s important to note that the broader bearish sequence is still unfolding. This suggests that after the completion of wave (B), the long-term downtrend could resume.

Technical Analyst: Sanmi Adeagbo

Source: visit Tradinglounge.com and learn From the Experts Join TradingLounge Here 

See Previous:Wheat  Elliott Wave Technical Analysis 

VALUE Offer - Buy 1 Month & Get 3 Months!Click here

Access 7 Analysts Over 200 Markets Covered. Chat Room With Support


Corn-Commodity-4h-Ch...

Conclusion

The Elliott Wave analysis for corn suggests that the current corrective rally may be short-lived. Traders should remain cautious, as the overall bearish trend continues, with the possibility of renewed downward movement approaching key resistance levels. Monitoring wave patterns and critical price points will be essential in anticipating market changes over the next few weeks.

Related

Elliott Wave Analysis: S&P 500, NASDAQ 100,  RUSSELL 2000, DAX 40, FTSE 100, ASX 200.

Elliott Wave Analysis: S&P 500, NASDAQ 100, RUSSELL 2000, DAX 40, FTSE 100, ASX 200.

Elliott Wave Analysis and Trading Strategies for Major Indices Market Outlook: Thursday: Anticip...

Read More >
Ripple (XRP) Price Prediction & Elliott Wave Technical Analysis: Stay Ahead with Expert Insights and Trading Strategies

Ripple (XRP) Price Prediction & Elliott Wave Technical Analysis: Stay Ahead with Expert Insights and Trading Strategies

In this analysis, we provide an in-depth look at Ripple's price prediction through Elliott Wave ...

Read More >
NIFTY 50 Elliott Wave Analysis: Market Forecast, Key Levels, Trading Strategy & Price Prediction Daily & 4H Chart Insights

NIFTY 50 Elliott Wave Analysis: Market Forecast, Key Levels, Trading Strategy & Price Prediction Daily & 4H Chart Insights

The NIFTY 50 INDEX is currently in a corrective wave structure, approaching the 22,000 - 22,100 zone...

Read More >
Palo Alto Networks (PANW) Stock Forecast: Elliott Wave Signals Bullish Reversal With Price Targets & Key Support at $150

Palo Alto Networks (PANW) Stock Forecast: Elliott Wave Signals Bullish Reversal With Price Targets & Key Support at $150

PANW stock shows bullish momentum with Elliott Wave analysis indicating a completed correction and a...

Read More >
IBEX 35 (Spain) Index Elliott Wave Technical Analysis: IBEX 35 Trading and Investment Strategies with Our Detailed Analysis

IBEX 35 (Spain) Index Elliott Wave Technical Analysis: IBEX 35 Trading and Investment Strategies with Our Detailed Analysis

Unlock valuable insights into IBEX 35 trading and investment strategies with our detailed analysis. ...

Read More >
South32 Limited Stock Analysis & Elliott Wave Technical Forecast: Critical Validation Points and Includes a Short-Term Forecast

South32 Limited Stock Analysis & Elliott Wave Technical Forecast: Critical Validation Points and Includes a Short-Term Forecast

This analysis provides an in-depth look at ASX: South32 Limited (S32) using Elliott Wave theory. It ...

Read More >

$1 for 2 Weeks

then $29 a month!

What a Special Offer!

Trade Recommendations

Unleash the power of deversified trading with our comprehensive portfolio, covering 250+ markets:

  • Stock Trades
  • Crypto Trades
  • Forex Trades
  • Commodity Trades
Elliott Wave Analysis

Gain a competitive edge with expert insights and AI-powered Elliott Wave charting into:

  • Global Indices
  • US Stocks & ASX Stocks
  • Forex & Crypto
  • Commodities
Top-Notch Trading Tools

Equip yourself with the tools of success:

  • Real-time Chat rooms
  • Elliott Wave Algorithm
  • Portfolio tools
  • TradingLevels
  • Screener
  • Trading Game
7 Elliott Wave Analysts

Stay ahead of the market with daily charts and insightful videos
Your secret to strategic trading!

JOIN HERE


Welcome to TradingLounge (ASIC A.R.No. 321187), specialists in trades, trading education and technical analysis, covering stocks, indices, commodities, forex and cryptocurrencies.

When you join TradingLounge you have access to everything we offer, including trade tools, educational content and a social platform to chat with like-minded investors.

Read more

@Copyright 2024 by tradinglounge.com

Contact Us

Australian no: 02 4787 6020

International no: +61 (2) 47876020

Pay with:

Find us on