10Jun

Amazon Elliott Wave Forecast Shows Strong Bullish Momentum in Daily and Hourly Charts with Accurate Wave Count Predictions

AMZN Elliott Wave Analysis – Trading Lounge Daily Chart

Amazon.com Inc. (AMZN) – Daily Chart Analysis

AMZN Elliott Wave Technical Analysis

Function: Trend

Mode: Impulsive

Structure: Motive

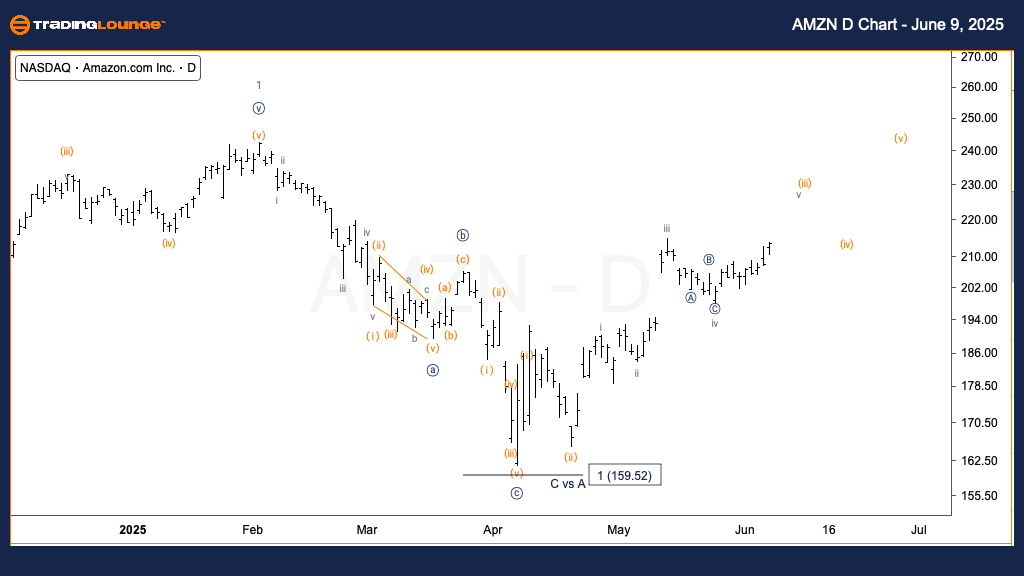
Position: Wave v of (iii)

Direction: Upward movement in wave (iii)

Details:
Amazon stock (AMZN) remains in an impulsive upward trend, progressing through Minuette wave (iii). Following a two-week consolidation near the key $200 resistance area (TradingLevel2), the price is now pushing towards the top boundary of MinorGroup1. This breakout indicates that the next bullish phase in the Elliott Wave cycle could be underway, reflecting positive momentum in Amazon’s stock price action.

AMZN-us-stock-D-Char...


AMZN Elliott Wave Analysis – Trading Lounge 1H Chart

Amazon.com Inc. (AMZN) – 1H Chart Analysis

AMZN Elliott Wave Technical Analysis

Function: Trend

Mode: Impulsive

Structure: Motive

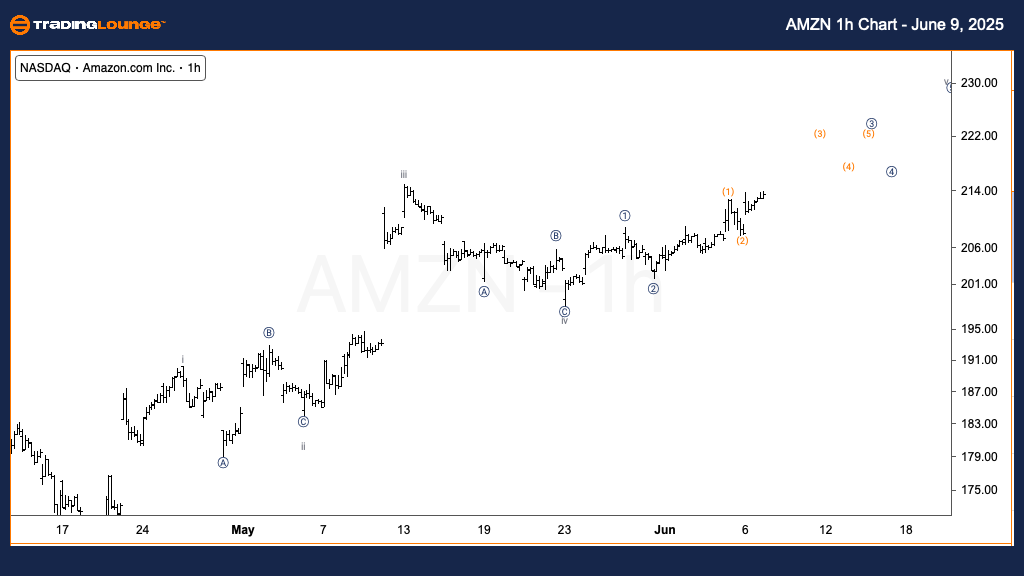
Position: Wave 3 of iii

Direction: Upward momentum in micro wave 3

Details:
On the 1-hour timeframe, Amazon's stock is forming a strong upward impulse, developing into submicro wave 3 within micro wave 3. This bullish wave structure supports the ongoing rally, with price momentum gaining strength. The current formation confirms the wave count and highlights potential for continued upward movement in the short term.

Technical Analyst: Alessio Barretta

Source: Visit Tradinglounge.com and learn from the Experts. Join TradingLounge Here 

Previous: SPOT Elliott Wave Technical Analysis

VALUE Offer - Buy 1 Month & Get 3 Months!Click here

Access 7 Analysts Over 200 Markets Covered. Chat Room With Support

AMZN-us-stock-1h-Cha...


Overview:
This Elliott Wave analysis of Amazon.com Inc. (AMZN) leverages both the daily and hourly charts to assess price dynamics through a technical lens. The broader trend shows an active Minuette wave (iii) climb, while the 1H chart reveals accelerating bullish activity in micro wave 3. These patterns support a strong short- and medium-term outlook for AMZN stock.

Related

TASI Index Elliott Wave Technical Analysis: Detailed look at current market trends

TASI Index Elliott Wave Technical Analysis: Detailed look at current market trends

This analysis of the TASI Index using Elliott Wave theory provides a detailed look at current market...

Read More >
GX Uranium ETF Elliott Wave Technical Analysis: Price Prediction, and Investment Opportunities in the Uranium Sector

GX Uranium ETF Elliott Wave Technical Analysis: Price Prediction, and Investment Opportunities in the Uranium Sector

GX Uranium ETF with the detailed Elliott Wave analysis. Understand key support levels, market trends...

Read More >
The Coca-Cola Company (KO:NYSE) Elliott Wave Technical Analysis 21 November 23

The Coca-Cola Company (KO:NYSE) Elliott Wave Technical Analysis 21 November 23

The Coca-Cola Company (KO: NYSE) Elliott Wave Technical Analysis dated 21 November 23, with 4-hour ...

Read More >
Bitcoin/USD (BTCUSD) Elliott Wave Technical Insights:  Market trends and actionable trading strategies

Bitcoin/USD (BTCUSD) Elliott Wave Technical Insights: Market trends and actionable trading strategies

Delve into the latest Elliott Wave analysis for Bitcoin/USD (BTCUSD) as of February 27, 2024, offeri...

Read More >

$1 for 2 Weeks

then $29 a month!

What a Special Offer!

Trade Recommendations

Unleash the power of deversified trading with our comprehensive portfolio, covering 250+ markets:

  • Stock Trades
  • Crypto Trades
  • Forex Trades
  • Commodity Trades
Elliott Wave Analysis

Gain a competitive edge with expert insights and AI-powered Elliott Wave charting into:

  • Global Indices
  • US Stocks & ASX Stocks
  • Forex & Crypto
  • Commodities
Top-Notch Trading Tools

Equip yourself with the tools of success:

  • Real-time Chat rooms
  • Elliott Wave Algorithm
  • Portfolio tools
  • TradingLevels
  • Screener
  • Trading Game
7 Elliott Wave Analysts

Stay ahead of the market with daily charts and insightful videos
Your secret to strategic trading!

JOIN HERE


Welcome to TradingLounge (ASIC A.R.No. 321187), specialists in trades, trading education and technical analysis, covering stocks, indices, commodities, forex and cryptocurrencies.

When you join TradingLounge you have access to everything we offer, including trade tools, educational content and a social platform to chat with like-minded investors.

Read more

@Copyright 2024 by tradinglounge.com

Contact Us

Australian no: 02 4787 6020

International no: +61 (2) 47876020

Pay with:

Find us on