20Jan

GX Uranium ETF Elliott Wave Technical Analysis: Price Prediction, and Investment Opportunities in the Uranium Sector

GX Uranium ETF Elliott Wave Analysis

After surpassing the May 2024 high in October, GX URA ETF began correcting the bullish impulse that initiated in August 2024. The current pullback has reached a critical Fibonacci retracement zone, suggesting a potential bounce that could propel the long-term bullish trend higher. Traders are closely monitoring this zone for confirmation of further upside momentum.

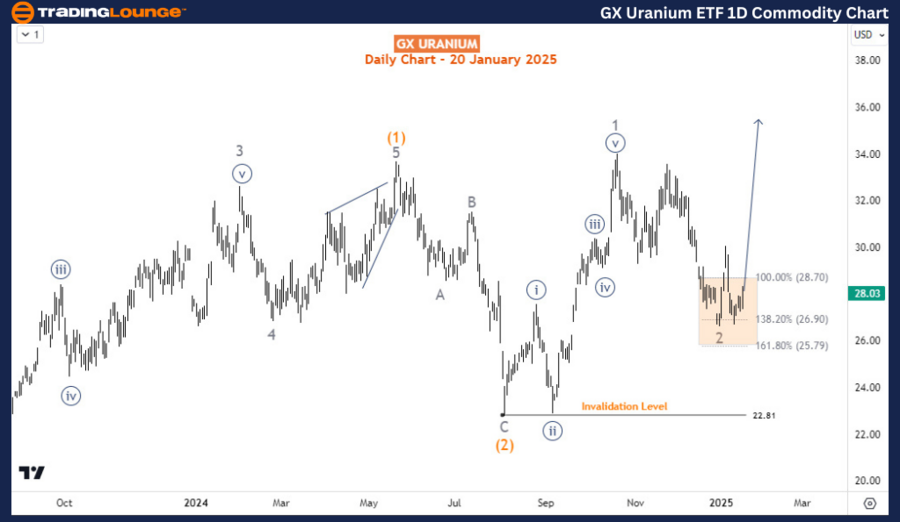
GX URA ETF Daily Chart Insights

In the long-term perspective, GX URA ETF is undergoing a correction of the bearish impulse pattern that spanned from February 2011 to March 2020. This corrective phase completed wave ((A)) in November 2021 and wave ((B)) in July 2022, leading to the development of wave ((C)).

The daily chart analysis indicates the completion of waves (1) and (2) of wave ((C)) in May 2024 and August 2024, respectively. The rally from August 2024, which broke above the May 2024 high, is identified as wave 1 of (3). The ongoing pullback from October 2024 is considered wave 2 of (3). As long as the 22.81 support level holds, bullish traders can anticipate upward momentum, potentially driving prices higher in the upcoming weeks.

GX-Uranium-ETF-1d-co...


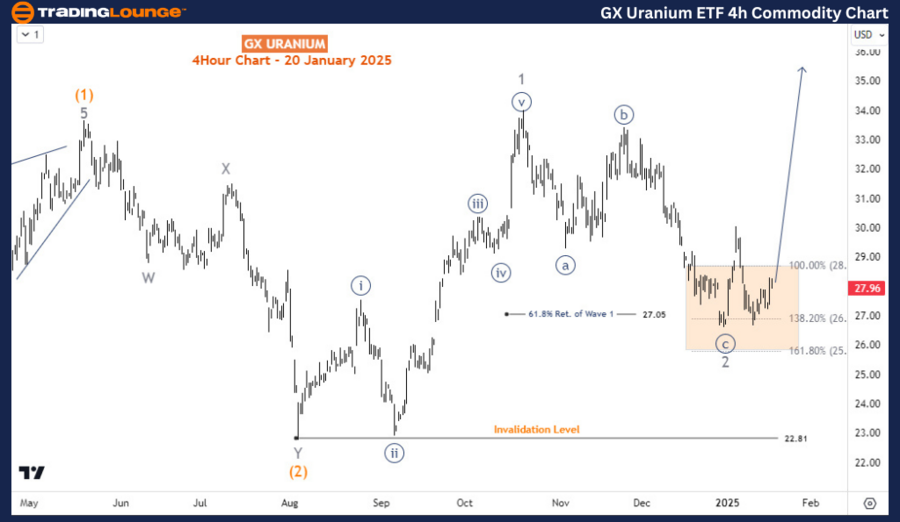
GX URA ETF H4 Chart Overview

The H4 chart analysis provides a closer look at the sub-waves of waves 1 and 2. The current pullback is approaching a critical Fibonacci support zone between 28.7 and 25.79. If this zone remains intact, it could reinforce bullish sentiment, paving the way for a rally in wave 3 of (3) toward the $42 mark in the coming weeks. The outlook remains bullish, with short- and medium-term upside potential favored.

Technical Analyst: Sanmi Adeagbo

Source: visit Tradinglounge.com and learn From the Experts Join TradingLounge Here 

See Previous: Coffee Elliott Wave Technical Analysis

VALUE Offer - Buy 1 Month & Get 3 Months!Click here

Access 7 Analysts Over 200 Markets Covered. Chat Room With Support

GX-Uranium-ETF-4h-co...

Related

Amcor PLC (ASX:AMC) Elliott Wave Analysis Forecasts Potential Wave 3 Breakout with Price Targets, Invalidation Levels

Amcor PLC (ASX:AMC) Elliott Wave Analysis Forecasts Potential Wave 3 Breakout with Price Targets, Invalidation Levels

Amcor PLC (ASX:AMC) technical report analyzes using Elliott Wave theory, forecasting a potential Wav...

Read More >
EUR/USD Elliott Wave Analysis Reveals Bullish Impulse Pattern Suggesting Continued Uptrend in Forex Market

EUR/USD Elliott Wave Analysis Reveals Bullish Impulse Pattern Suggesting Continued Uptrend in Forex Market

The EUR/USD pair exhibits a bullish impulsive pattern according to Elliott Wave analysis, indicating...

Read More >
In-Depth Euro/British Pound Forex Elliott Wave Technical Analysis: Mastering EURGBP Trading

In-Depth Euro/British Pound Forex Elliott Wave Technical Analysis: Mastering EURGBP Trading

Dive into our comprehensive Elliott Wave analysis of the EURGBP currency pair. This article provides...

Read More >
Comprehensive ITC India Elliott Wave Analysis Reveals Bullish Trend with Detailed Price Forecast and Technical Insights

Comprehensive ITC India Elliott Wave Analysis Reveals Bullish Trend with Detailed Price Forecast and Technical Insights

This analysis delves into ITC India's stock movement using Elliott Wave Theory, identifying a bu...

Read More >
Elliott Wave Analysis of S&P BSE SENSEX NEXT 50 Shows Bullish Trend with Wave 3 in Play and Key Support at 70146

Elliott Wave Analysis of S&P BSE SENSEX NEXT 50 Shows Bullish Trend with Wave 3 in Play and Key Support at 70146

Elliott Wave technical analysis of the S&P BSE SENSEX NEXT 50 shows a strong bullish impulsive struc...

Read More >
KOSPI Composite Index Elliott Wave Analysis Daily and Weekly Charts Signal Bullish Trend with Impulsive Wave Formation

KOSPI Composite Index Elliott Wave Analysis Daily and Weekly Charts Signal Bullish Trend with Impulsive Wave Formation

Elliott Wave analysis on the KOSPI Composite reveals a new impulsive trend on daily and weekly chart...

Read More >

$1 for 2 Weeks

then $29 a month!

What a Special Offer!

Trade Recommendations

Unleash the power of deversified trading with our comprehensive portfolio, covering 250+ markets:

  • Stock Trades
  • Crypto Trades
  • Forex Trades
  • Commodity Trades
Elliott Wave Analysis

Gain a competitive edge with expert insights and AI-powered Elliott Wave charting into:

  • Global Indices
  • US Stocks & ASX Stocks
  • Forex & Crypto
  • Commodities
Top-Notch Trading Tools

Equip yourself with the tools of success:

  • Real-time Chat rooms
  • Elliott Wave Algorithm
  • Portfolio tools
  • TradingLevels
  • Screener
  • Trading Game
7 Elliott Wave Analysts

Stay ahead of the market with daily charts and insightful videos
Your secret to strategic trading!

JOIN HERE


Welcome to TradingLounge (ASIC A.R.No. 321187), specialists in trades, trading education and technical analysis, covering stocks, indices, commodities, forex and cryptocurrencies.

When you join TradingLounge you have access to everything we offer, including trade tools, educational content and a social platform to chat with like-minded investors.

Read more

@Copyright 2024 by tradinglounge.com

Contact Us

Australian no: 02 4787 6020

International no: +61 (2) 47876020

Pay with:

Find us on