16Jan

Coffee Elliott Wave Technical Analysis: Market Trends, Resistance Levels, and Investment Strategies for Commodity Traders

Coffee Elliott Wave Analysis

Coffee has recently broken past the May 2011 high, which was established over 13 years ago. With this breakout, the commodity has achieved a fresh record high, even surpassing the historical peak from March 1977. Over the past year, coffee prices have surged approximately 80%, making it one of the most lucrative commodities for investors. As this rally reaches new heights, the pressing question is: where could the next resistance for this commodity emerge?

Coffee Long-Term Analysis

From a broader perspective, the all-time chart for coffee, dating back to the early 1970s, reveals a sideways, corrective, and choppy trend. Following the completion of a bearish zigzag structure in May 2019, coffee embarked on a new corrective zigzag structure to the upside. Starting from May 2019, the price completed wave W of the cycle degree by February 2022, which was followed by a wave X pullback of the same degree in January 2023.

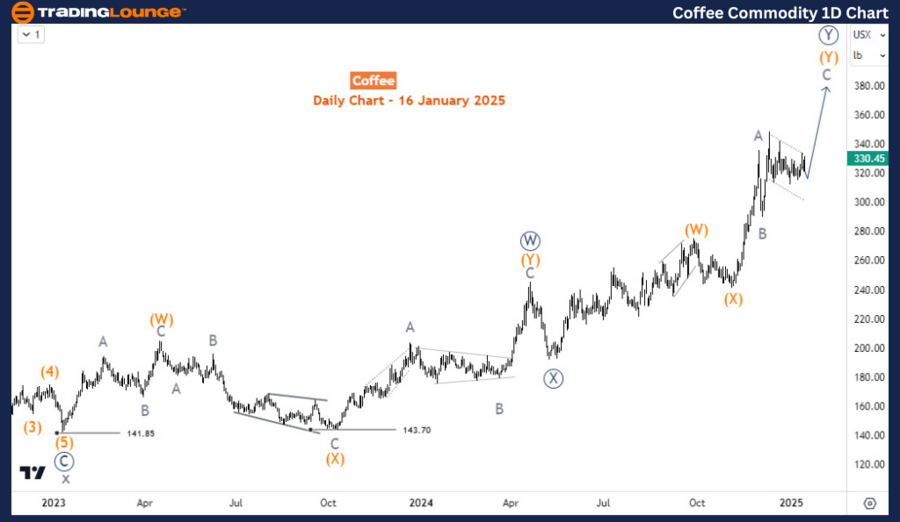
Coffee Daily Chart Analysis

Since January 2023, the cycle degree wave Y has unfolded as a double zigzag structure, completing waves ((W)) and ((X)) in April and May 2024, respectively. The price is now in wave ((Y)), as indicated by the daily chart. Within wave ((Y)), the structure shows completed waves (W) and (X), with the price currently advancing within wave C of (Y). We anticipate wave ((Y)) to conclude within the 317.65–425 range. While the price has already entered this zone, the wave structure appears incomplete, suggesting potential upward movement to 358 or even higher. This scenario implies that buyers may still find opportunities to enter the market during pullbacks for higher price targets.

Coffee-Commodity-1d-...


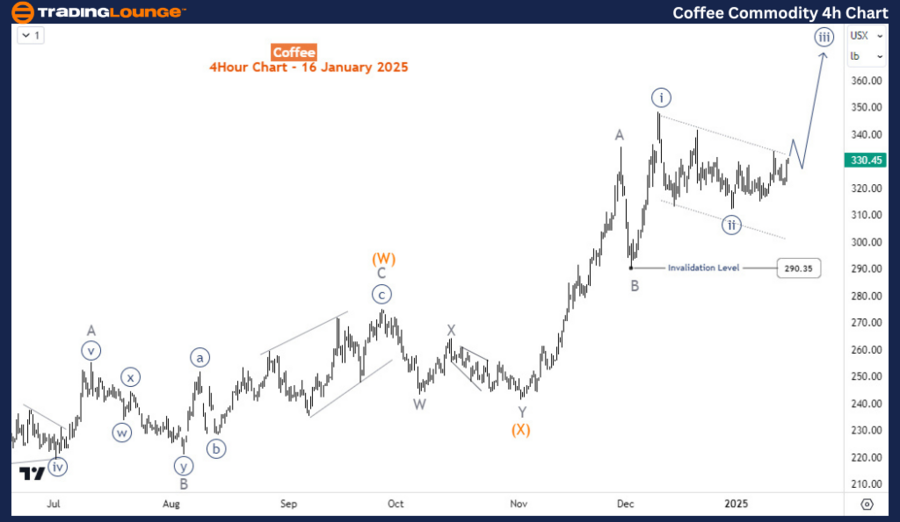
Coffee H4 Chart Analysis

On the H4 chart, the price action suggests wave ((ii)) of C may be complete. Alternatively, the price could dip further in a double zigzag toward 298. However, as long as the 290.35 level remains intact, wave ((iii)) is expected to extend upward along the trajectory of wave C of (Y) within ((Y)). This setup supports a bullish outlook, with potential for higher prices in the near term.

Technical Analyst: Sanmi Adeagbo

Source: visit Tradinglounge.com and learn From the Experts Join TradingLounge Here 

See Previous: Soybean Elliott Wave Technical Analysis

VALUE Offer - Buy 1 Month & Get 3 Months!Click here

Access 7 Analysts Over 200 Markets Covered. Chat Room With Support

Coffee-Commodity-4h-...

Related

NextEra Energy Inc.(NEE) Stocks Elliott Wave Technical Analysis: Overview of Current trends in both the Daily and 1-hour Charts

NextEra Energy Inc.(NEE) Stocks Elliott Wave Technical Analysis: Overview of Current trends in both the Daily and 1-hour Charts

This Elliott Wave analysis of NextEra Energy Inc. (NEE) provides a detailed overview of current tren...

Read More >
Bullish Elliott Wave Analysis and Trading Strategy for Major Indices Ahead of U.S. Economic Data Releases

Bullish Elliott Wave Analysis and Trading Strategy for Major Indices Ahead of U.S. Economic Data Releases

We are monitoring bullish Elliott Wave patterns across major indices, particularly the S&P 500, NASD...

Read More >
VeChain/U.S. dollar(VETUSD) Elliott Wave Technical Analysis 18 October 23

VeChain/U.S. dollar(VETUSD) Elliott Wave Technical Analysis 18 October 23

TradingLounge 4H chart and Day chart for VeChain/U.S. dollar(VETUSD) Elliott Wave Technical Analysis...

Read More >
Mastering U.S.Dollar/Japanese Yen (USDJPY) Elliott Wave Analysis: Unveils Key Insights and Trading Strategies

Mastering U.S.Dollar/Japanese Yen (USDJPY) Elliott Wave Analysis: Unveils Key Insights and Trading Strategies

Our USDJPY Elliott Wave Analysis provides traders with invaluable insights for navigating the forex ...

Read More >
Swiss Market Index Elliott Wave Technical Analysis: Covering key Trading Strategies, Investment Insights, and Market Updates

Swiss Market Index Elliott Wave Technical Analysis: Covering key Trading Strategies, Investment Insights, and Market Updates

This comprehensive guide provides an in-depth Elliott Wave analysis of the Swiss Market Index (SMI ...

Read More >
NASDAQ Elliott Wave Analysis: Stock Market Trends, Impulse Wave Forecast, Trading Strategies, and Key Resistance & Support Levels

NASDAQ Elliott Wave Analysis: Stock Market Trends, Impulse Wave Forecast, Trading Strategies, and Key Resistance & Support Levels

NASDAQ Elliott Wave Analysis, covering technical indicators, price movements, and market trends. Lea...

Read More >

Buy 1 Month

Get 3 Months!

Special Offer:

Trade Recommendations

Unleash the power of deversified trading with our comprehensive portfolio, covering:

  • Stock Trades
  • Crypto Trades
  • Forex Trades
  • Commodity Trades
Elliott Wave Analysis

Gain a competive edge with expert insights in to:

  • Global Indices
  • US Stocks & ASX Stocks
  • Forex & Crypto
  • Commodities
Top-Notch Trading Tools

Equip yourself with the tools of success:

  • Social Chat
  • Elliott Wave Algorithm
  • Screener
  • TradingLevels
  • Trading Game
7 Elliott Wave Analysts

Stay ahead of the market with daily charts and insightful videos
-Your secret to strategic trading!

JOIN HERE


Welcome to TradingLounge (ASIC A.R.No. 321187), specialists in trades, trading education and technical analysis, covering stocks, indices, commodities, forex and cryptocurrencies.

When you join TradingLounge you have access to everything we offer, including trade tools, educational content and a social platform to chat with like-minded investors.

Read more

@Copyright 2024 by tradinglounge.com

Contact Us

Australian no: 02 4787 6020

International no: +61 (2) 47876020

Pay with:

Find us on