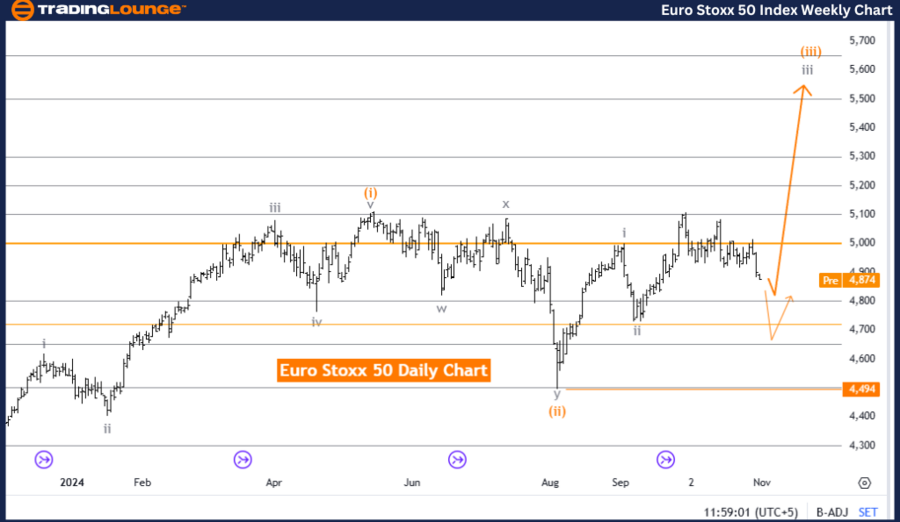
Euro Stoxx 50 Elliott Wave Analysis - Trading Lounge Day Chart
Euro Stoxx 50 Elliott Wave Technical Analysis
Function: Bullish Trend
Mode: Impulsive
Structure: Gray wave 3
Position: Orange wave 3
Next Higher Degree Direction: Gray wave 3 (initiated)
Details: Gray wave 2 is complete, with gray wave 3 of orange wave 3 now active.
Wave Cancel Level: 4,494
Euro Stoxx 50 Day Chart Analysis
The daily Elliott Wave analysis for the Euro Stoxx 50 suggests a strong bullish trend within an impulsive structure. The current formation, gray wave 3 within orange wave 3, underscores continued bullish momentum. With gray wave 2 complete, gray wave 3 is now advancing within orange wave 3, signaling a solid push higher, aligning with the broader uptrend.
This wave setup suggests sustained upward movement as gray wave 3 within orange wave 3 typically represents robust gains in line with Elliott Wave principles. The unfolding of gray wave 3 points to additional upward momentum, supporting potential price gains within this bullish phase.
The wave cancel level is set at 4,494. A break below this level would invalidate the current Elliott Wave interpretation, potentially signaling a trend reversal. Conversely, as long as the price holds above this threshold, the bullish outlook remains intact, highlighting the progression of gray wave 3 within orange wave 3.
Summary
The Euro Stoxx 50 daily chart continues to signal a bullish trend, driven by the progression of gray wave 3 within orange wave 3. With gray wave 2 behind us, further gains are likely as long as the price stays above 4,494. This configuration supports the broader bullish trend as gray wave 3 moves forward.
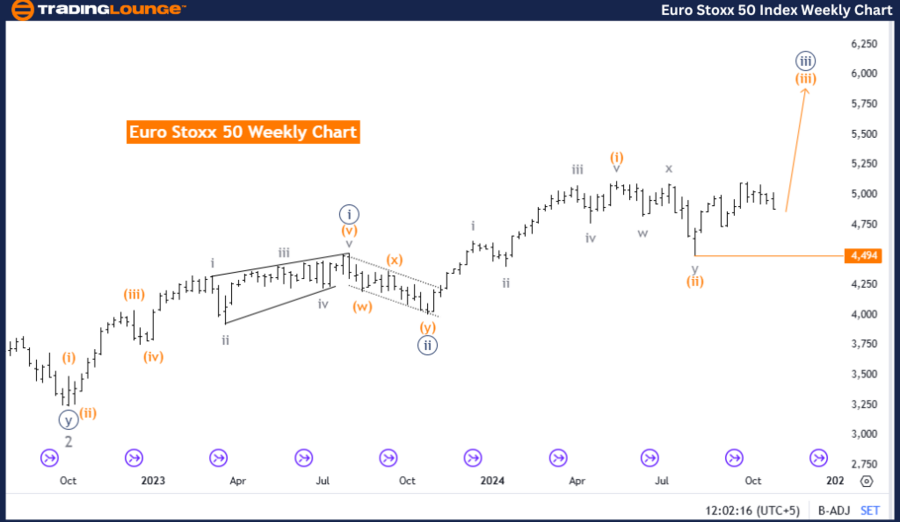
Euro Stoxx 50 Elliott Wave Analysis - Trading Lounge Weekly Chart
Euro Stoxx 50 Elliott Wave Technical Analysis
Function: Bullish Trend
Mode: Impulsive
Structure: Orange wave 3
Position: Navy blue wave 3
Next Higher Degree Direction: Orange wave 3 (initiated)
Details: Orange wave 2 is complete, allowing orange wave 3 to advance.
Wave Cancel Level: 4,494
Euro Stoxx 50 Weekly Chart Analysis
The weekly Elliott Wave analysis of the Euro Stoxx 50 indicates a bullish trajectory in an impulsive structure, currently advancing within orange wave 3, in alignment with navy blue wave 3. With orange wave 2 concluded, orange wave 3 is now developing, supporting the bullish trend.
In Elliott Wave terms, wave 3 typically propels price strongly within the trend's direction. The ongoing formation of orange wave 3 within navy blue wave 3 highlights potential for significant upward movement, confirming the broader bullish direction.
The wave cancel level remains at 4,494. A decline below this threshold would invalidate the current Elliott Wave outlook, suggesting a possible trend reversal or correction. However, maintaining this level supports the bullish outlook, aligning with the ongoing development of orange wave 3 within navy blue wave 3.
Summary
The Euro Stoxx 50 weekly chart shows a bullish trend within an impulsive mode, with orange wave 3 advancing after completing orange wave 2. This structure suggests continued gains, provided the price stays above 4,494, reinforcing the bullish trajectory within the larger upward trend of orange wave 3.
Technical Analyst: Malik Awais
Source: visit Tradinglounge.com and learn From the Experts Join TradingLounge Here
Previous: NIFTY 50 Elliott Wave Technical Analysis
VALUE Offer - Buy 1 Month & Get 3 Months!Click here
Access 7 Analysts Over 200 Markets Covered. Chat Room With Support