21Aug

Vanguard Australian Shares Index ETFA and V300AEQ ETF UNITS – VAS Stock Analysis & Elliott Wave Technical Forecast

ASX: V300AEQ ETF UNITS – VAS Elliott Wave Technical Analysis and Trading Outlook (1D Chart)

Greetings, our latest Elliott Wave analysis focuses on the Australian Stock Exchange (ASX) with V300AEQ ETF UNITS – VAS. The current pattern suggests VAS might begin a bullish movement with a 3-grey wave formation.

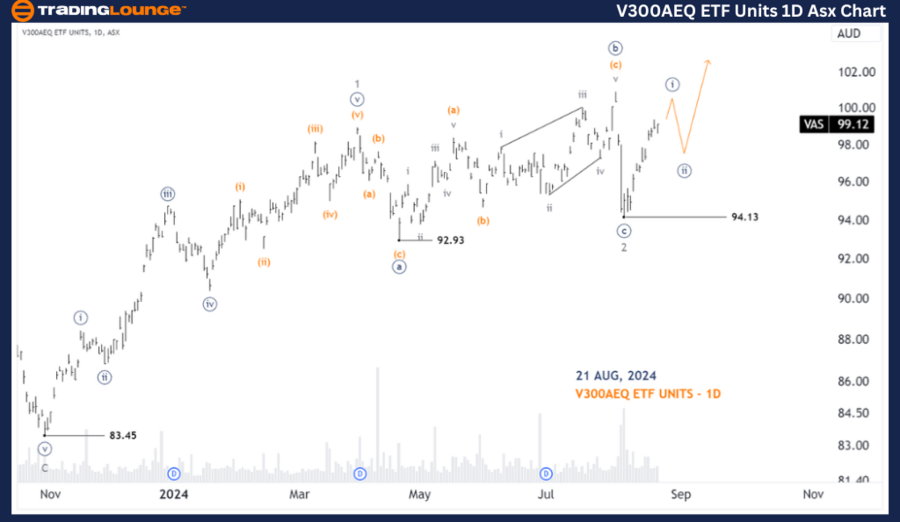
VAS Elliott Wave Technical Analysis (1D Chart)

ASX: Vanguard Australian Shares Index ETFA

ASX: V300AEQ ETF UNITS – VAS 1D Chart (Semilog Scale) Analysis

  • Function: Major Trend (Minor degree, grey)

  • Mode: Motive

  • Structure: Impulse

  • Position: Wave ((i))-navy of Wave 3-grey

  • Details: Wave 3-grey is currently unfolding to push higher. It is subdividing into wave ((i))-navy, which may extend upward shortly before concluding, after which wave ((ii))-navy is expected to push lower.

  • Invalidation Point: 94.13

V300AEQ-ETF-UNITS-1D...


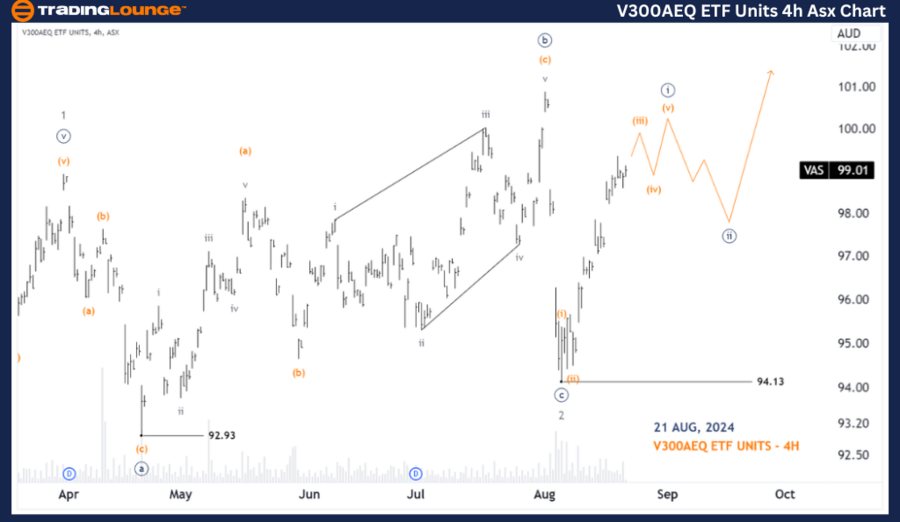
ASX: V300AEQ ETF UNITS – VAS Elliott Wave Analysis (4-Hour Chart)

ASX: V300AEQ ETF UNITS – VAS 4-Hour Chart Analysis

  • Function: Major Trend (Minute degree, navy)

  • Mode: Motive

  • Structure: Impulse

  • Position: Wave (iii)-orange of Wave ((i))-navy

  • Details: Since the low at 94.13, the ((i))-navy wave is unfolding, subdividing into (i), (ii), (iii), (iv), (v)-orange waves. This structure is expected to continue pushing slightly higher to complete the ((i))-navy wave. Subsequently, wave ((ii))-navy may unfold with a downward move, after which the uptrend is likely to resume with the continuation of the ((iii))-navy wave. A Long Trade Setup could be considered with the formation of the ((ii))-navy wave.

  • Invalidation Point: 94.13

Technical Analyst: Hua (Shane) Cuong, CEWA-M (Master’s Designation).

Source: visit Tradinglounge.com and learn From the Experts Join TradingLounge Here 

Previous:  REA GROUP LTD Elliott Wave Technical Analysis

Special Trial Offer - 0.76 Cents a Day for 3 Months! Click here

Access 7 Analysts Over 200 Markets Covered. Chat Room With Support

V300AEQ-ETF-UNITS-4h...


Conclusion

Our Elliott Wave analysis and short-term outlook for ASX: V300AEQ ETF UNITS – VAS aim to equip traders with actionable insights into the current market trends. By providing specific price levels as validation or invalidation points for our wave count, we enhance the reliability of our forecast. This approach ensures that our readers receive a clear, objective, and professional perspective on the ongoing market dynamics.

Related

Unlocking The CODE: ADANI PORTS - Indian Stocks With Elliott Wave Strategy, Stock Forecast, and Market Trend

Unlocking The CODE: ADANI PORTS - Indian Stocks With Elliott Wave Strategy, Stock Forecast, and Market Trend

ADANI PORTS & SEZ examines the stock's current corrective structure on both daily and weekly cha...

Read More >
Unlocking ASX Trading Success: V300AEQ ETF UNITS – VAS Stock Analysis & Elliott Wave Technical Forecast

Unlocking ASX Trading Success: V300AEQ ETF UNITS – VAS Stock Analysis & Elliott Wave Technical Forecast

This article provides an in-depth Elliott Wave technical analysis of the ASX VAS ETF Units, highligh...

Read More >
In-depth Elliott Wave Technical Analysis of SOUTH32 LIMITED (S32) listed on the Australian Stock Exchange (ASX)

In-depth Elliott Wave Technical Analysis of SOUTH32 LIMITED (S32) listed on the Australian Stock Exchange (ASX)

This article provides an in-depth Elliott Wave analysis of SOUTH32 LIMITED (S32) listed on the Austr...

Read More >
Forex Pair USDCAD Elliott Wave Forecast: Bearish Impulse Wave 3 Extends – Risk Levels, and Resistance Targets Identified

Forex Pair USDCAD Elliott Wave Forecast: Bearish Impulse Wave 3 Extends – Risk Levels, and Resistance Targets Identified

USDCAD shows a strong bearish Elliott Wave impulse on both daily and 4-hour charts. Wave 3 is in mot...

Read More >
ChainLink / U.S. dollar(LINKUSD) Elliott Wave Technical Analysis 2 November 23

ChainLink / U.S. dollar(LINKUSD) Elliott Wave Technical Analysis 2 November 23

Chainlink/U.S. dollar (LINKUSD) Elliott Wave Technical Analysis for 2 November 23, Elliott Wave Anal...

Read More >
 Costco Stock Market Trends and Prepare for Possible Corrections: Costco Wholesale Corp. (COST) Elliott Wave Technical Analysis

Costco Stock Market Trends and Prepare for Possible Corrections: Costco Wholesale Corp. (COST) Elliott Wave Technical Analysis

Explore our latest Elliott Wave analysis for Costco Wholesale Corp. (COST) to uncover potential trad...

Read More >

$1 for 2 Weeks

then $29 a month!

What a Special Offer!

Trade Recommendations

Unleash the power of deversified trading with our comprehensive portfolio, covering 250+ markets:

  • Stock Trades
  • Crypto Trades
  • Forex Trades
  • Commodity Trades
Elliott Wave Analysis

Gain a competitive edge with expert insights and AI-powered Elliott Wave charting into:

  • Global Indices
  • US Stocks & ASX Stocks
  • Forex & Crypto
  • Commodities
Top-Notch Trading Tools

Equip yourself with the tools of success:

  • Real-time Chat rooms
  • Elliott Wave Algorithm
  • Portfolio tools
  • TradingLevels
  • Screener
  • Trading Game
7 Elliott Wave Analysts

Stay ahead of the market with daily charts and insightful videos
Your secret to strategic trading!

JOIN HERE


Welcome to TradingLounge (ASIC A.R.No. 321187), specialists in trades, trading education and technical analysis, covering stocks, indices, commodities, forex and cryptocurrencies.

When you join TradingLounge you have access to everything we offer, including trade tools, educational content and a social platform to chat with like-minded investors.

Read more

@Copyright 2024 by tradinglounge.com

Contact Us

Australian no: 02 4787 6020

International no: +61 (2) 47876020

Pay with:

Find us on