Berkshire Hathaway Inc. (BRK.B) Elliott Wave Analysis – Daily & 1H Chart
This Elliott Wave analysis for Berkshire Hathaway Inc. (BRK.B) evaluates both the daily and 1-hour charts, providing insights into market trends and potential price movements.
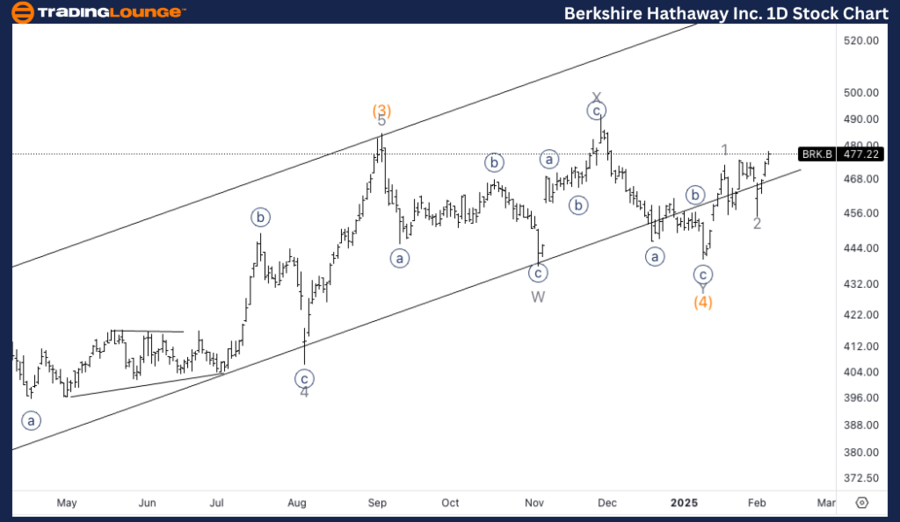
BRK.B Elliott Wave Analysis – TradingLounge Daily Chart
Berkshire Hathaway Inc. (BRK.B) Daily Chart Overview
BRK.B Elliott Wave Technical Analysis
Function: Trend
Mode: Impulsive
Structure: Motive
Position: Wave 3 of (5)
Direction: Upside within wave (5)
Details: The intermediate wave (5) is expected to continue its steady rise, approaching Trading Level 5 at $500. The equality projection of wave (5) vs. wave (1) at $543 suggests there is still room for further upside momentum.
BRK.B Elliott Wave Daily Chart Analysis
Berkshire Hathaway Inc. (BRK.B) is currently in an impulsive wave structure, positioned in wave 3 of (5). The upward trend is expected to persist, with intermediate wave (5) targeting $500. The price action suggests further growth potential, as the equality of wave (5) to wave (1) indicates a possible target of $543. Traders should watch for continued bullish momentum as wave (5) unfolds.
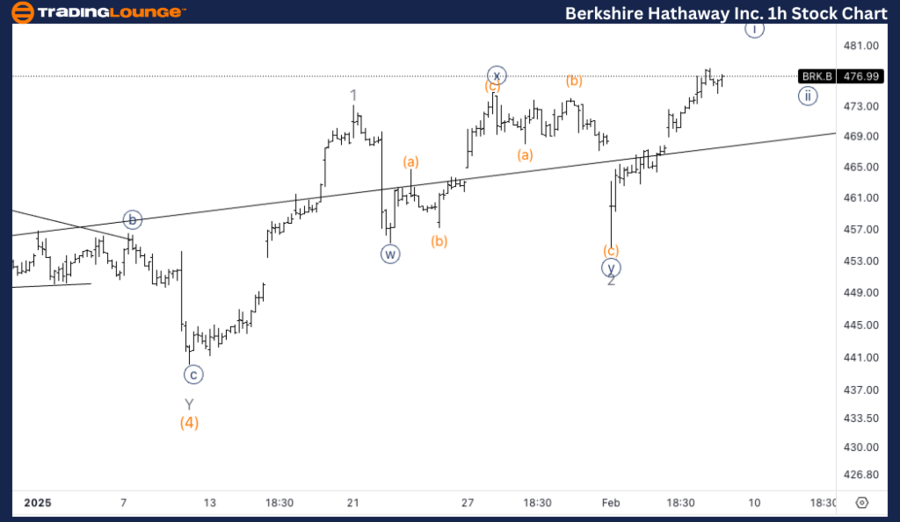
BRK.B Elliott Wave Analysis – TradingLounge 1H Chart
Berkshire Hathaway Inc. (BRK.B) 1-Hour Chart Overview
ASX BRK.B Stock Technical Analysis
Function: Trend
Mode: Impulsive
Structure: Motive
Position: Wave {i} of 3
Direction: Approaching wave {i} top
Details: The wave {i} top is nearing completion, followed by a potential corrective pullback, which may present a buying opportunity.
BRK.B Elliott Wave 1H Chart Analysis
On the 1-hour chart, BRK.B appears to be reaching the top of wave {i} of 3. Once this wave tops out, a corrective pullback is anticipated, which could provide an opportunity for traders to enter long positions before the next bullish move into wave {iii}. Monitoring support levels during the retracement will be crucial to identifying a strong continuation setup for further upside momentum.
Technical Analyst: Alessio Barretta
Source: visit Tradinglounge.com and learn From the Experts Join TradingLounge Here
See Previous: The Boeing Company (BA) Elliott Wave Technical Analysis
VALUE Offer - Buy 1 Month & Get 3 Months!Click here
Access 7 Analysts Over 200 Markets Covered. Chat Room With Support