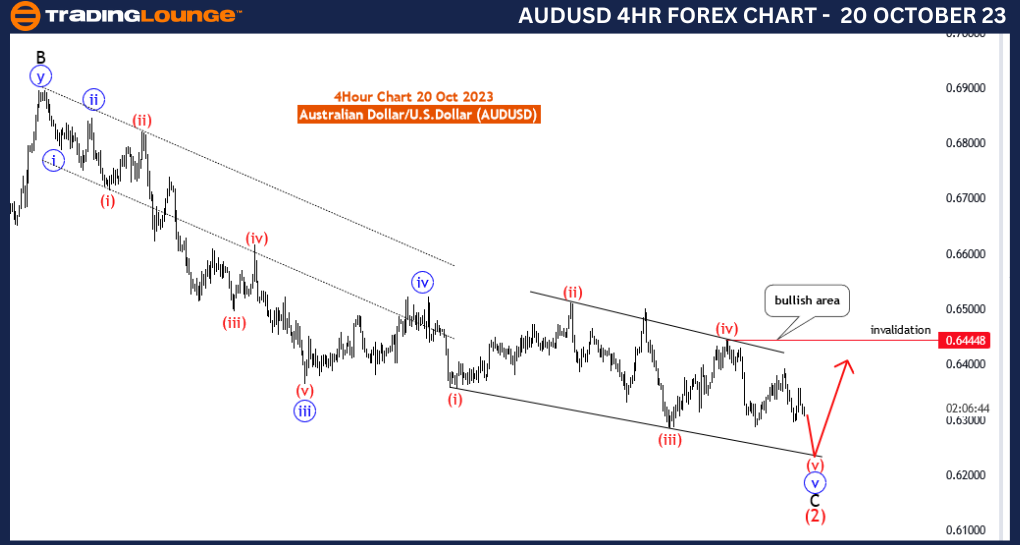
AUDUSD Elliott Wave Analysis Trading Lounge 4 Hour Chart, 20 October 23
Australian Dollar/U.S.Dollar (AUDUSD) 4 Hour Chart
AUDUSD Elliott Wave Technical Analysis
Function: Counter Trend
Mode: impulsive
Structure: red wave 5 of ending diagonal 5
Position: C of red wave 2
Direction Next Higher Degrees: Main Red wave 3
Details: red wave 4 completed at 0.64448 now 5 of diagonal 5 is in play and near to end. Wave Cancel invalid level: 0.64448
The AUDUSD Elliott Wave Analysis for the 4-hour chart on 20 October 23, provides valuable insights into the dynamics of the Australian Dollar/US Dollar (AUDUSD) currency pair. This information is essential for traders and investors looking to navigate market trends and anticipate potential price movements.
The analysis categorizes the market function as "Counter Trend," indicating that the current price movement goes against the prevailing trend. Understanding this counter-trend movement is crucial for traders who are seeking opportunities to capitalize on possible price reversals within the broader trend.
The "impulsive" mode classification suggests that the counter-trend movement is unfolding with strong and decisive force. Impulsive movements often lead to substantial price changes, which can be attractive for traders focusing on short- to medium-term trading opportunities.
The primary focus of this analysis is on "red wave 5 of ending diagonal 5," signifying a specific phase within the broader market structure. Ending diagonals are patterns that can indicate an imminent trend reversal. As wave 5 of this diagonal unfolds, traders should be alert for potential trend-changing signals.
The analysis notes that "red wave 4 completed at 0.64448," indicating the end of a corrective phase and the initiation of "5 of diagonal 5." Corrective phases can be challenging to navigate, and the completion of wave 4 is an important milestone for traders to monitor.
The "Wave Cancel invalid level: 0.64448" serves as a crucial reference point. It guides risk management and helps traders determine when the specified wave structure is invalidated, signaling a shift in market dynamics.
In summary, the AUDUSD Elliott Wave Analysis for 20 October 23, offers insightful information regarding the AUDUSD currency pair. It emphasizes the current phase, "5 of diagonal 5," following the completion of wave 4. Traders should remain vigilant, closely monitoring the market for potential trading opportunities, and keep a close eye on the provided invalidation level for effective risk management.
Technical Analyst: Malik Awais
Source: Tradinglounge.com get trial here!
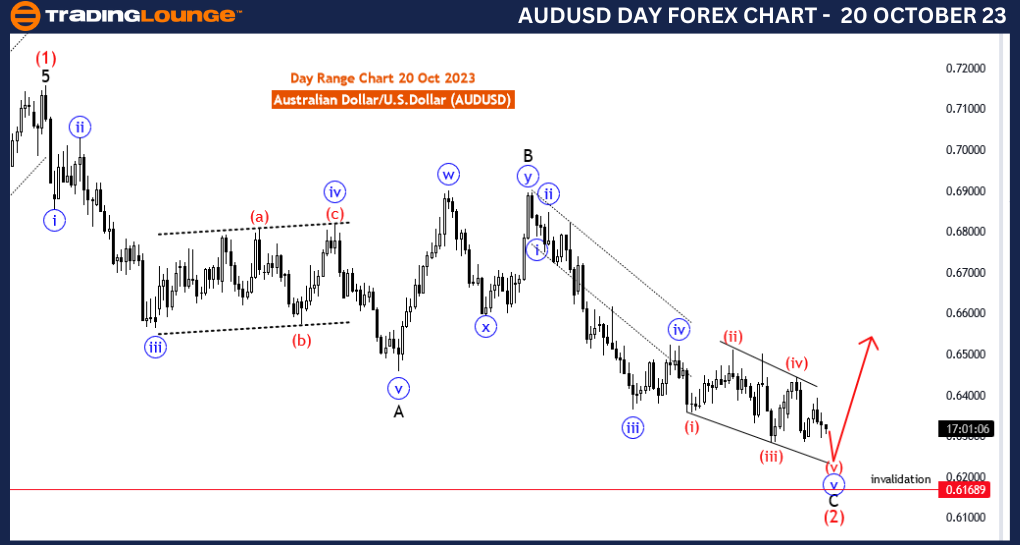
AUDUSD Elliott Wave Analysis Trading Lounge Day Chart, 20 October 23
Australian Dollar/U.S.Dollar (AUDUSD) Day Chart
AUDUSD Elliott Wave Technical Analysis
Function: Counter Trend
Mode: impulsive
Structure: red wave 5 of ending diagonal 5
Position: C of red wave 2
Direction Next Higher Degrees: Main Red wave 3
Details: red wave 4 completed at 0.64448 now 5 of diagonal 5 is in play and near to end. Wave Cancel invalid level: 0.61689
The AUDUSD Elliott Wave Analysis for the day chart on 20 October 23, is a vital resource for traders and investors seeking to understand the movements of the Australian Dollar/US Dollar (AUDUSD) currency pair. This analysis offers an in-depth view of the market structure and identifies key phases in the ongoing trend.
The analysis classifies the market function as "Counter Trend," indicating that the current price movement is against the predominant trend. This is essential information for traders as it suggests a potential reversal or correction in the market.
The "impulsive" mode categorization suggests that the counter-trend move is strong and decisive. Such impulsive movements often lead to significant price fluctuations, making them a focus for traders looking for short- to medium-term opportunities.
The core of this analysis revolves around "red wave 5 of ending diagonal 5," indicating a specific stage within the broader market structure. Ending diagonals are patterns that often signal a forthcoming trend reversal. As wave 5 of this diagonal progresses, traders should be on high alert for potential signals that the trend is about to change direction.
The report highlights that "red wave 4 completed at 0.64448," signifying the end of a corrective phase and the initiation of "5 of diagonal 5." Corrective phases can be challenging to navigate, and the completion of wave 4 is an important milestone for traders.
Of utmost importance is the "Wave Cancel invalid level: 0.61689." This level is critical for managing risk and helps traders determine when the described wave structure is invalidated, signaling a shift in market dynamics.
In summary, the AUDUSD Elliott Wave Analysis for 20 October 23, delivers valuable insights into the AUDUSD currency pair. With a focus on the ongoing phase, "5 of diagonal 5," following the conclusion of wave 4, traders should maintain a vigilant approach, closely observing the market for potential trading opportunities, and take into account the provided invalidation level for effective risk management.
Technical Analyst: Malik Awais
Source: Tradinglounge.com get trial here!