DAX 40 (Germany) Elliott Wave Analysis Trading Lounge Day Chart

DAX (Germany) India Daily Chart Analysis

DAX 40 Elliott Wave Technical Analysis

FUNCTION: Bullish Trend

MODE: Impulsive

STRUCTURE: Gray Wave 3

POSITION: Orange Wave 3

DIRECTION NEXT LOWER DEGREES: Gray Wave 4

DETAILS: Gray Wave 2 appears complete. Currently, Gray Wave 3 of Orange Wave 3 is in progress.

Wave Cancel Invalid Level: 18,182.52

The DAX (Germany) daily chart indicates a bullish trend forming within an impulsive wave structure. The market is currently in Gray Wave 3, positioned inside Orange Wave 3, pointing towards strong upward momentum.

With Gray Wave 2 completed, the market is unfolding Gray Wave 3 within Orange Wave 3, fueling the ongoing bullish trend. Impulsive wave structures often signal robust market trends, and Gray Wave 3 typically represents a powerful phase within the Elliott Wave cycle.

The next lower-degree wave, Gray Wave 4, is anticipated once the current wave concludes. However, the market remains focused on Gray Wave 3, continuing its upward trajectory within this bullish framework.

The wave cancellation level is set at 18,182.52. A fall below this threshold would invalidate the current Elliott Wave count, potentially marking the end of the current upward movement or the beginning of a new wave pattern.

Summary:

  • Bullish Trend: Active Gray Wave 3 of Orange Wave 3 unfolding.
  • Gray Wave 2 completed, indicating further upward progress.
  • As long as the price remains above 18,182.52, the bullish trend should continue.

DAX-40-Index-Daily-C...


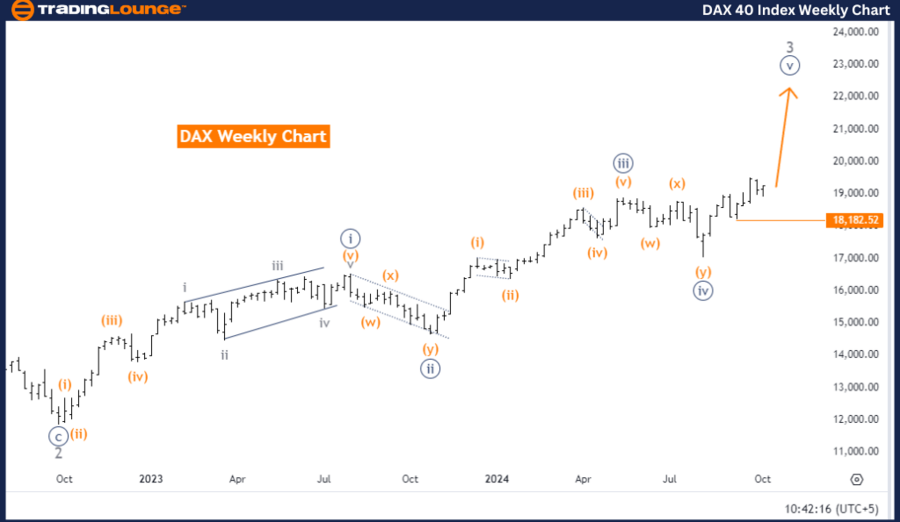
DAX 40 (Germany) Elliott Wave Analysis Trading Lounge Weekly Chart

DAX (Germany) Elliott Wave Technical Analysis

FUNCTION: Bullish Trend

MODE: Impulsive

STRUCTURE: Navy Blue Wave 5

POSITION: Gray Wave 3

DIRECTION NEXT LOWER DEGREES: Gray Wave 4

DETAILS: Navy Blue Wave 4 appears complete. Currently, Navy Blue Wave 5 is in progress.

Wave Cancel Invalid Level: 18,182.52

The weekly chart of the DAX (Germany) signals a bullish trend within an impulsive wave structure. The current wave position is Navy Blue Wave 5, with the market in Gray Wave 3, indicating ongoing upward movement.

With Navy Blue Wave 4 concluded, the market is now progressing through Navy Blue Wave 5, suggesting that the market is entering the final stage of the Elliott Wave cycle for this higher degree. The impulsive nature of Navy Blue Wave 5 is driving the bullish trend further.

The next lower-degree wave, Gray Wave 4, will follow after Gray Wave 3 completes. Currently, Gray Wave 3 is driving the market upwards, maintaining the bullish momentum.

The wave cancellation level remains at 18,182.52. A drop below this level would invalidate the current Elliott Wave count, signaling either the end of the bullish trend or the onset of a corrective phase.

Summary:

  • Bullish Trend: Navy Blue Wave 5 in progress after Navy Blue Wave 4 completion.
  • Gray Wave 3 is driving prices upward, with potential continuation as long as the price remains above 18,182.52.

Technical Analyst: Malik Awais

Source: visit Tradinglounge.com and learn From the Experts Join TradingLounge Here 

Previous: TASI Index Elliott Wave Technical Analysis

VALUE Offer - Buy 1 Month & Get 3 Months!Click here

Access 7 Analysts Over 200 Markets Covered. Chat Room With Support

DAX-40-Index-Weekly-...

Related

Navigating Market Trends: Apple Inc. Elliott Wave Technical Analysis and AAPL market dynamics

Navigating Market Trends: Apple Inc. Elliott Wave Technical Analysis and AAPL market dynamics

Delve into the latest AAPL market dynamics with our detailed Elliott Wave analysis. Gain insights in...

Read More >
Profitable HSI Trading with Hang Seng Index Elliott Wave Technical Analysis, HSI Market Trends, and Top Investment Tips

Profitable HSI Trading with Hang Seng Index Elliott Wave Technical Analysis, HSI Market Trends, and Top Investment Tips

This article provides an in-depth Hang Seng trading and HSI analysis, offering insights into Elliott...

Read More >
Bharat Electricals Stock Analysis – BEL Stocks Elliott Wave Technical Analysis Including Daily and 4H Chart Insights

Bharat Electricals Stock Analysis – BEL Stocks Elliott Wave Technical Analysis Including Daily and 4H Chart Insights

This article provides a comprehensive Elliott Wave analysis of Bharat Electricals (BEL) stock, inclu...

Read More >
ASX: Santos Limited (STO) Stock Analysis & Elliott Wave Technical Forecast with Key Trends and Actionable Trading Strategies

ASX: Santos Limited (STO) Stock Analysis & Elliott Wave Technical Forecast with Key Trends and Actionable Trading Strategies

Get detailed Elliott Wave analysis for ASX: SANTOS LIMITED (STO), including stock trends, price pred...

Read More >
Elliott Wave Technical Analysis: Indices Overview S&P 500, NASDAQ 100, RUSSELL 2000, DAX 40, FTSE 100, ASX 200

Elliott Wave Technical Analysis: Indices Overview S&P 500, NASDAQ 100, RUSSELL 2000, DAX 40, FTSE 100, ASX 200

In this analysis, we take a comprehensive look at the S&P 500, NASDAQ 100, Russell 2000, DAX 40, FTS...

Read More >
Explore the current Bitcoin Crypto Price trends Today Elliott Wave Technical Analysis to make informed decisions

Explore the current Bitcoin Crypto Price trends Today Elliott Wave Technical Analysis to make informed decisions

In this article, we provide a detailed BTCUSD Elliott Wave analysis focusing on Bitcoin price trends...

Read More >

$1 for 2 Weeks

then $29 a month!

What a Special Offer!

Trade Recommendations

Unleash the power of deversified trading with our comprehensive portfolio, covering 250+ markets:

  • Stock Trades
  • Crypto Trades
  • Forex Trades
  • Commodity Trades
Elliott Wave Analysis

Gain a competitive edge with expert insights and AI-powered Elliott Wave charting into:

  • Global Indices
  • US Stocks & ASX Stocks
  • Forex & Crypto
  • Commodities
Top-Notch Trading Tools

Equip yourself with the tools of success:

  • Real-time Chat rooms
  • Elliott Wave Algorithm
  • Portfolio tools
  • TradingLevels
  • Screener
  • Trading Game
7 Elliott Wave Analysts

Stay ahead of the market with daily charts and insightful videos
Your secret to strategic trading!

JOIN HERE


Welcome to TradingLounge (ASIC A.R.No. 321187), specialists in trades, trading education and technical analysis, covering stocks, indices, commodities, forex and cryptocurrencies.

When you join TradingLounge you have access to everything we offer, including trade tools, educational content and a social platform to chat with like-minded investors.

Read more

@Copyright 2024 by tradinglounge.com

Contact Us

Australian no: 02 4787 6020

International no: +61 (2) 47876020

Pay with:

Find us on