Vanguard Australian Shares Index ETF – TradingLounge (1D Chart)

Greetings! Today's Elliott Wave analysis focuses on the Australian Stock Exchange (ASX) with V300AEQ ETF UNITS – VAS. According to our analysis, VAS may have completed wave 2-grey, and wave 3-grey is currently unfolding, pushing the price higher.

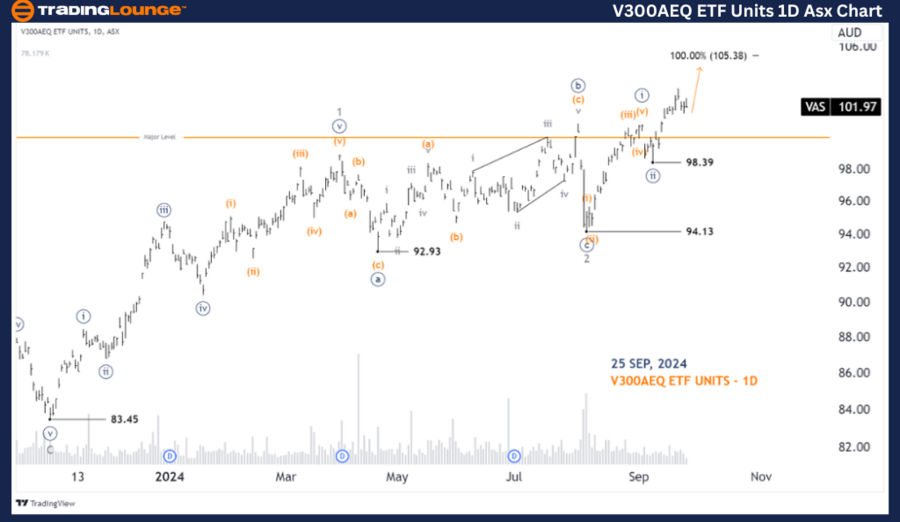
ASX: V300AEQ ETF UNITS – VAS 1D Chart (Semilog Scale) Analysis

VAS Elliott Wave Technical Analysis

Function: Major trend (Minor degree, grey)

Mode: Motive

Structure: Impulse

Position: Wave ((iii))-navy of Wave 3-grey

Details: From the low of 94.13, wave 3-grey is progressing higher. Within this wave, wave ((iii))-navy is forming, which is expected to continue pushing upwards, aiming for the next target at 105.50 and potentially higher. The price must stay above 98.39 to keep this view valid.

Invalidation point: 98.39

V300AEQ-ETF-Units-1D...


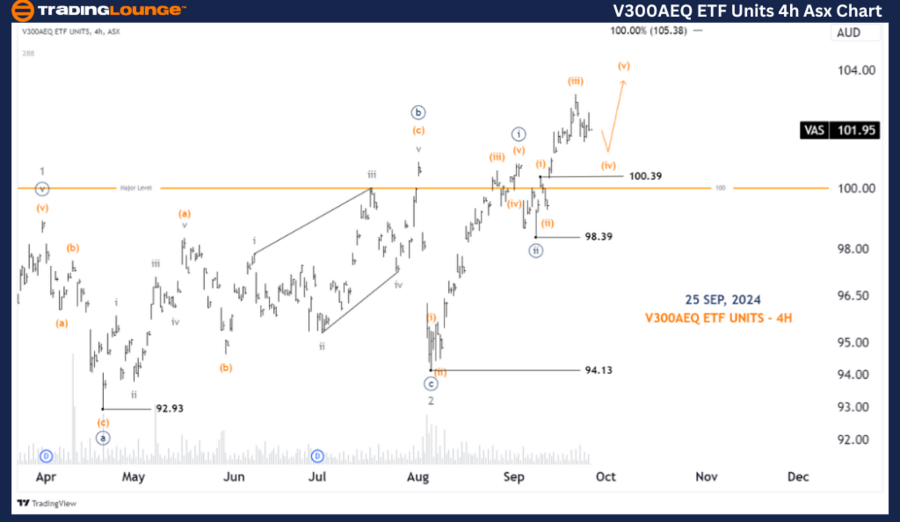
ASX: V300AEQ ETF UNITS – VAS 4-Hour Chart Analysis

Vanguard Australian Shares Index ETF (VAS)

Function: Major trend (Minute degree, navy)

Mode: Motive

Structure: Impulse

Position: Wave (iii)-orange of Wave ((iii))-navy

Details: From the low of 98.39, wave ((iii))-navy continues to push higher, further subdividing into wave (iii)-orange. This wave is expected to push slightly higher before wave (iv)-orange unfolds, pushing lower. Ultimately, wave (v)-orange will complete the move, continuing the upward trend. The price must remain above 100.39 to maintain this bullish outlook.

Invalidation point: 100.39

Technical Analyst: Hua (Shane) Cuong, CEWA-M (Master’s Designation).

Source: visit Tradinglounge.com and learn From the Experts Join TradingLounge Here 

See Previous: Brambles Limited - BXB Elliott Wave Technical Analysis

VALUE Offer - Buy 1 Month & Get 3 Months!Click here

Access 7 Analysts Over 200 Markets Covered. Chat Room With Support

V300AEQ-ETF-Units-4h...


Conclusion:

Our updated Elliott Wave analysis provides a comprehensive overview of the current market trends for ASX: V300AEQ ETF UNITS – VAS. By focusing on key price points, we aim to offer traders a clear understanding of potential validation or invalidation levels. This approach helps increase confidence in our wave count and supports a more informed trading strategy. Combining technical insights with these critical levels, we strive to offer the most objective and professional perspective on market movements.

Related

State Bank of India stock analysis using Elliott Wave forecast reveals bullish trend, share price movement, and market outlook.

State Bank of India stock analysis using Elliott Wave forecast reveals bullish trend, share price movement, and market outlook.

State Bank of India (SBI) through the lens of Elliott Wave Theory. It highlights the current bullish...

Read More >
XRPUSD Elliott Wave Analysis Shows Key Fibonacci Support with Bullish Breakout Potential for Crypto Traders and Swing Trading Strategy

XRPUSD Elliott Wave Analysis Shows Key Fibonacci Support with Bullish Breakout Potential for Crypto Traders and Swing Trading Strategy

This article offers an in-depth XRPUSD Elliott Wave analysis featuring key support/resistance levels...

Read More >
Euro/ U.S. Dollar (EURUSD) Forex Elliott Wave Technical Analysis:  Detailed insights into the current market trends

Euro/ U.S. Dollar (EURUSD) Forex Elliott Wave Technical Analysis: Detailed insights into the current market trends

This article provides a comprehensive Elliott Wave Analysis of the EURUSD pair, covering both day an...

Read More >
Mahindra & Mahindra Stock Analysis: Elliott Wave Forecast Reveals Bullish Trend, Critical Support Levels, and Upcoming Price Movements

Mahindra & Mahindra Stock Analysis: Elliott Wave Forecast Reveals Bullish Trend, Critical Support Levels, and Upcoming Price Movements

Mahindra & Mahindra stock analysis uses Elliott Wave patterns to forecast bullish trends, key suppor...

Read More >
Gold (XAUUSD) Commodity Ongoing Bullish Trend in the Market: In-Depth Elliott Wave Technical Analysis and Forecast

Gold (XAUUSD) Commodity Ongoing Bullish Trend in the Market: In-Depth Elliott Wave Technical Analysis and Forecast

In this detailed Gold Elliott Wave analysis, we explore the ongoing bullish trend in the gold market...

Read More >

$1 for 2 Weeks

then $29 a month!

What a Special Offer!

Trade Recommendations

Unleash the power of deversified trading with our comprehensive portfolio, covering 250+ markets:

  • Stock Trades
  • Crypto Trades
  • Forex Trades
  • Commodity Trades
Elliott Wave Analysis

Gain a competitive edge with expert insights and AI-powered Elliott Wave charting into:

  • Global Indices
  • US Stocks & ASX Stocks
  • Forex & Crypto
  • Commodities
Top-Notch Trading Tools

Equip yourself with the tools of success:

  • Real-time Chat rooms
  • Elliott Wave Algorithm
  • Portfolio tools
  • TradingLevels
  • Screener
  • Trading Game
7 Elliott Wave Analysts

Stay ahead of the market with daily charts and insightful videos
Your secret to strategic trading!

JOIN HERE


Welcome to TradingLounge (ASIC A.R.No. 321187), specialists in trades, trading education and technical analysis, covering stocks, indices, commodities, forex and cryptocurrencies.

When you join TradingLounge you have access to everything we offer, including trade tools, educational content and a social platform to chat with like-minded investors.

Read more

@Copyright 2024 by tradinglounge.com

Contact Us

Australian no: 02 4787 6020

International no: +61 (2) 47876020

Pay with:

Find us on