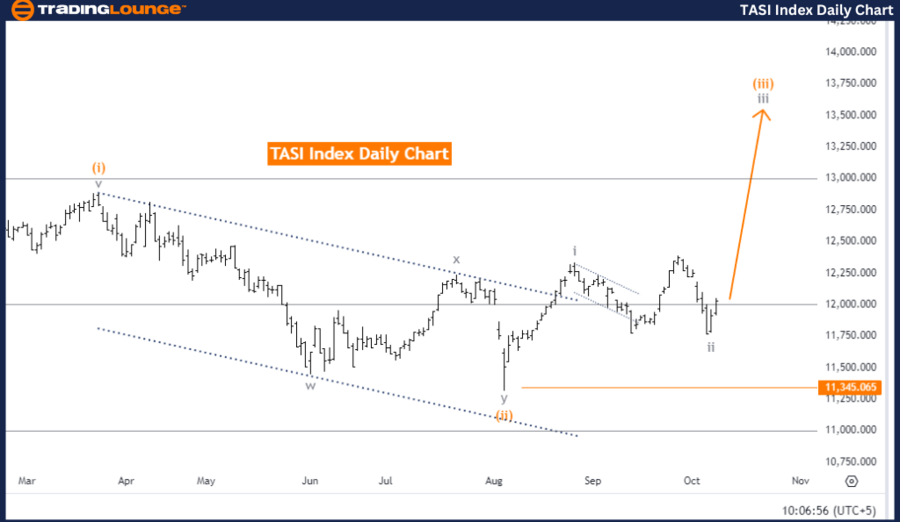
TASI Index Elliott Wave Analysis | TradingLounge Daily Chart
TASI Index Daily Chart Technical Analysis
TASI Index Elliott Wave Technical Analysis
Function: Trend
Mode: Impulsive
Structure: Gray wave 3
Position: Orange wave 3
Next Lower Degrees: Gray wave 4
Details: Gray wave 2 completed, gray wave 3 in progress
Wave Invalidation Level: 11345.065
The daily Elliott Wave analysis of the TASI Index suggests a continuation of the impulsive bullish trend, currently in gray wave 3. The structure implies a strong upward momentum as gray wave 2 has completed, and the market is advancing through gray wave 3. This progression indicates that the upward trend is likely to extend as part of the larger impulsive wave movement.
In this wave count, the current position is within orange wave 3, a sub-wave of gray wave 3. This stage represents a robust upward push following the corrective phase of gray wave 2. The market is expected to continue rising until gray wave 3 completes, after which it will transition into gray wave 4, the next corrective phase.
For now, the bullish trend remains dominant as gray wave 3 is still ongoing. However, a drop below the invalidation level of 11345.065 would invalidate the current wave structure, necessitating a reevaluation of the market's direction. Until then, the bullish Elliott Wave scenario remains valid.
Summary:
- The TASI Index is in an impulsive bullish trend.
- Gray wave 3 is currently in progress, following the completion of gray wave 2.
- Orange wave 3 is pushing the market higher.
- The bullish trend remains valid as long as the market stays above the invalidation level of 11345.065.
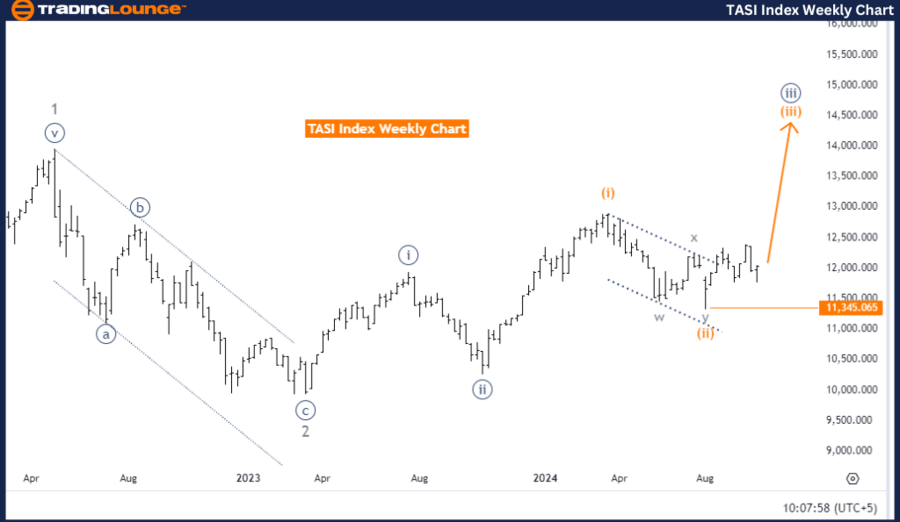
TASI Index Elliott Wave Analysis | TradingLounge Weekly Chart
TASI Index Elliott Wave Technical Analysis
Function: Trend
Mode: Impulsive
Structure: Orange wave 3
Position: Navy blue wave 3
Next Lower Degrees: Orange wave 4
Details: Orange wave 2 completed, orange wave 3 in progress
Wave Invalidation Level: 11345.065
The weekly Elliott Wave analysis of the TASI Index also confirms an impulsive trend, with orange wave 3 currently in progress. The wave structure points to a bullish continuation, as orange wave 2 has concluded and the market is now advancing through orange wave 3. This phase is characterized by strong upward momentum, typical of wave 3 in the Elliott Wave framework.
At present, the market is moving through navy blue wave 3, a sub-wave of orange wave 3. Following the completion of orange wave 2, the current wave count suggests that the upward trend will persist until orange wave 3 completes. Afterward, the market is expected to enter orange wave 4, signaling the start of the next corrective phase. For now, the impulsive upward movement continues to dominate the market.
The invalidation level for this wave count is 11345.065. A break below this level would invalidate the current structure, indicating that the impulsive wave scenario is no longer in effect. As long as the market holds above this level, the bullish trend driven by orange wave 3 is expected to continue.
Summary:
- The TASI Index is in an impulsive trend on the weekly chart.
- Orange wave 3 is currently active after the completion of orange wave 2.
- The market is advancing through navy blue wave 3.
- The bullish trend is expected to persist until orange wave 3 completes.
- The trend remains valid as long as the market stays above the invalidation level of 11345.065.
Technical Analyst: Malik Awais
Source: visit Tradinglounge.com and learn From the Experts Join TradingLounge Here
Previous: KOSPI Composite Elliott Wave Technical Analysis
VALUE Offer - Buy 1 Month & Get 3 Months!Click here
Access 7 Analysts Over 200 Markets Covered. Chat Room With Support