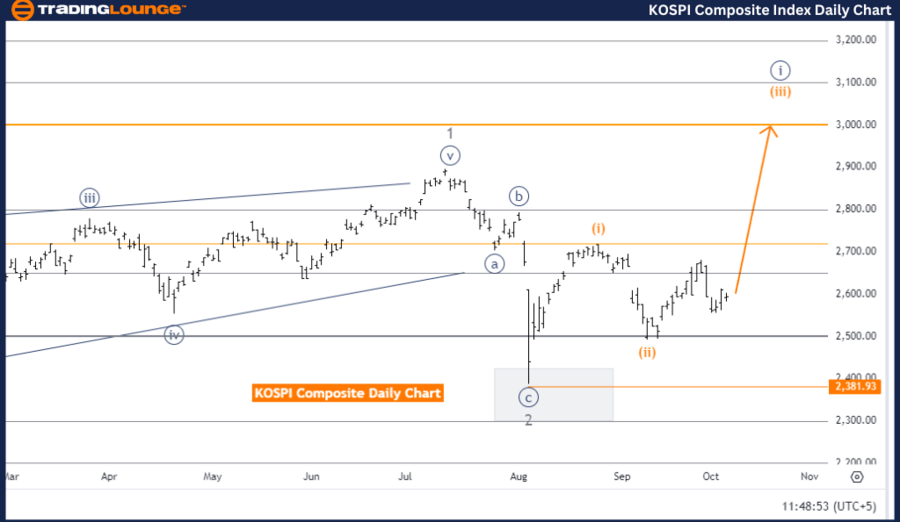
KOSPI Composite Elliott Wave Analysis | Trading Lounge Day Chart
KOSPI Composite Elliott Wave Technical Analysis
Function: Bullish Trend
Mode: Impulsive
Structure: Orange Wave 3
Position: Navy Blue Wave 1
Next Higher Degree: Orange Wave 3 (Started)
Details: Orange wave 2 appears completed, orange wave 3 now active.
Invalidation Level: 2381.93
The KOSPI Composite Elliott Wave analysis on the daily chart indicates a bullish trend in progress. This analysis operates in impulsive mode, signaling a strong upward movement. The focus is on orange wave 3, indicating an ongoing bullish phase.
Currently, the wave position is in navy blue wave 1, marking the early stage of a broader uptrend. With orange wave 2 completed, the market is transitioning to orange wave 3, often regarded as the most powerful wave in an Elliott Wave sequence. According to Elliott Wave theory, wave 3 typically shows the strongest price movement in an impulse sequence.
The higher-degree trend aligns with the bullish sentiment, confirming that orange wave 3 has now started, which suggests further upward momentum and rising prices.
The invalidation level stands at 2381.93. Should the market drop below this key level, the current wave count would be invalidated, leading to a reassessment of the bullish trend. Traders should monitor this level closely to maintain a positive outlook.
In summary, the KOSPI Composite daily chart shows a bullish trend, with orange wave 3 in play following the completion of orange wave 2. The upward trajectory is expected to continue unless prices fall below 2381.93, invalidating the current Elliott Wave count.
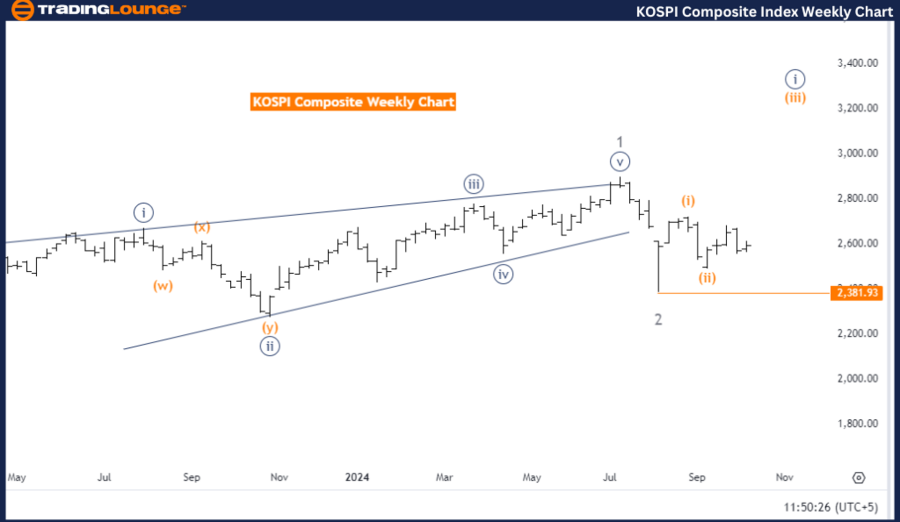
KOSPI Composite Elliott Wave Analysis | Trading Lounge Weekly Chart
KOSPI Composite Elliott Wave Technical Analysis
Function: Bullish Trend
Mode: Impulsive
Structure: Orange Wave 3
Position: Navy Blue Wave 1
Next Lower Degree: Orange Wave 4
Details: Orange wave 2 is completed, orange wave 3 is active.
Invalidation Level: 2381.93
The KOSPI Composite Elliott Wave analysis on the weekly chart points to a bullish trend in impulsive mode, highlighting strong upward momentum. The main structure, orange wave 3, indicates the market is undergoing a significant upward push.
The market is positioned in navy blue wave 1, signaling the start of a larger bullish cycle. The completion of orange wave 2 has led to the activation of orange wave 3, which is typically the most dynamic wave in an impulsive sequence, often driving significant price appreciation.
Looking forward, the next lower degree suggests that orange wave 4 (a corrective wave) may follow the completion of orange wave 3. For now, the bullish momentum remains strong, with expectations that orange wave 3 will continue driving the market higher.
The invalidation level is set at 2381.93. A drop below this level would invalidate the current wave count, suggesting the bullish trend may be at risk, and the market would need reevaluation. This level serves as a crucial point for traders to track to maintain a bullish outlook.
In summary, the KOSPI Composite weekly chart suggests the market is in a bullish phase, with orange wave 3 advancing after the completion of orange wave 2. The upward trend is likely to persist unless prices dip below 2381.93, which would invalidate the current wave structure.
Technical Analyst: Malik Awais
Source: visit Tradinglounge.com and learn From the Experts Join TradingLounge Here
Previous: S&P 500 Elliott Wave Technical Analysis
VALUE Offer - Buy 1 Month & Get 3 Months!Click here
Access 7 Analysts Over 200 Markets Covered. Chat Room With Support