Introduction to NEOUSD's Market Dynamics
In the fascinating realm of cryptocurrency trading, NEOUSD stands out as a significant player. Our in-depth technical analysis leverages the Elliott Wave Theory to offer unique insights into NEOUSD's price movements. This approach not only helps in identifying the current trends and future directions but also in making informed trading decisions.
Daily Analysis of NEOUSD through the Lens of Elliott Wave Theory
Unravelling the NEOUSD Daily Crypto Chart with Elliott Wave Analysis
NEOUSD Elliott Wave Technical Analysis
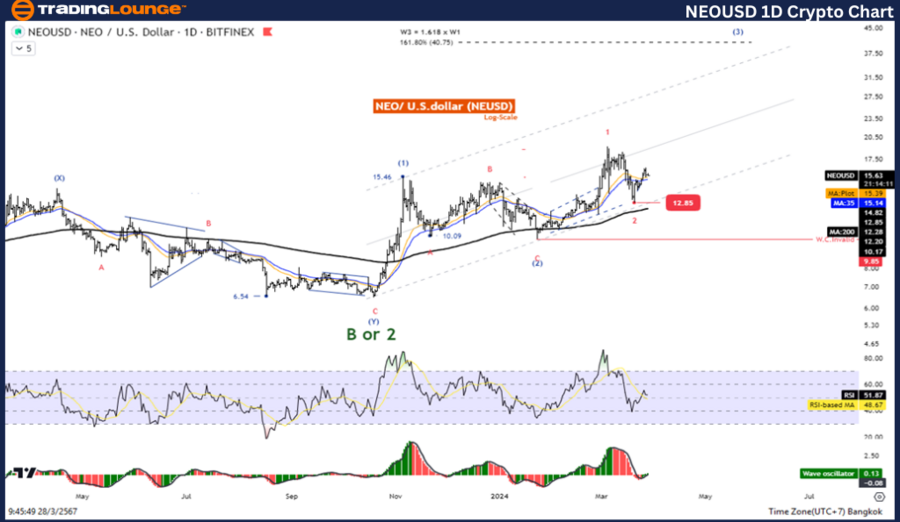
The daily chart of NEOUSD reveals a compelling narrative of its price action, characterized by its adherence to the Elliott Wave principles. The analysis underscores a bullish trend, with the currency moving in a motive mode. This phase is indicative of a strong market direction, generally associated with positive market sentiment.
- Function: The primary function at this stage is to follow the trend, which is bullish.
- Mode: It's operating in a Motive mode, suggesting a strong directional movement.
- Structure: The structure is identified as an Impulse, indicating a robust and straightforward trend.
- Position: Currently, NEOUSD is in Wave (3), a critical phase in the Elliott Wave structure that often represents a significant price movement.
- Direction for Next Higher Degrees: The analysis forecasts that we are moving towards Wave ((3)) of an Impulse, hinting at a continued bullish trend.
- Wave Cancellation Invalid Level: A drop below 9.85 would invalidate this wave pattern, serving as a crucial stop-loss point for traders.
- Details: The magnitude of Wave (3) is poised to reach 161.8% of Wave (1) at a target price of 24.52, suggesting a strong upward momentum.
Hourly Analysis of NEOUSD: A Counter-Trend Perspective
NEOUSD Elliott Wave Insight on the H4 Crypto Chart
Switching to the H4 (4-hour) timeframe, the NEOUSD presents a contrasting narrative. Here, the currency exhibits a counter-trend movement, characterized by corrective phases. This scenario is typical in markets experiencing a temporary reversal or consolidation after a significant trend.
- Function: The function shifts to counter the prevailing trend, highlighting a corrective phase in the market.
- Mode: The mode is Corrective, indicating a phase where the market is adjusting or retracting from its prior movements.
- Structure: The structure is a Zigzag, a common corrective pattern in Elliott Wave Theory, suggesting a sharp, counter-trend movement.
- Position: NEOUSD finds itself in Wave (C), an essential component of the corrective phase, potentially marking the end of the correction.
- Direction for Next Higher Degrees: The expectation is to move towards Wave ((2))) of an Impulse, signalling a preparatory phase for the next major bullish wave.
- Wave Cancellation Invalid Level: The critical level of 9.85 remains a vital point, below which the current wave pattern would be considered invalid.
- Details: Wave ((2)) is projected to equal 61.8% of Wave ((1)) at 14.24, offering insights into the potential reversal zones and areas of interest for traders focusing on short-term corrections.
Conclusion: Navigating the NEOUSD Market with Elliott Wave Analysis
The dual analysis of NEOUSD, encompassing both daily and hourly perspectives, offers a holistic view of its market dynamics. By understanding the underlying Elliott Wave patterns, traders can navigate the volatile cryptocurrency markets with greater confidence and precision. Whether it's capitalizing on the bullish trends indicated on the daily charts or identifying corrective opportunities in the H4 timeframe, Elliott Wave Analysis remains a potent tool for decrypting the complexities of the NEOUSD market.
Remember, while Elliott Wave Theory provides a structured framework for market analysis, incorporating other technical indicators and fundamental analysis can enhance decision-making and optimize trading strategies.
Technical Analyst: Kittiampon Somboonsod
Source: visit Tradinglounge.com and learn From the Experts Join TradingLounge Here
See Previous: Bitcoin/ U.S. dollar(BTCUSD)
TradingLounge Once Off SPECIAL DEAL: Here > 1 month Get 3 months.
TradingLounge's Free Week Extravaganza!
April 14 – 21: Unlock the Doors to Trading Excellence — Absolutely FREE
