Unlocking Market Opportunities with BTCUSD Elliott Wave Analysis
In the world of cryptocurrency trading, understanding market trends and patterns is essential for making informed decisions. Elliott Wave Analysis provides traders with valuable insights into the market's behaviour, helping them identify potential trading opportunities. Today, we delve into the Elliott Wave Analysis of Bitcoin/U.S. Dollar (BTCUSD) to uncover actionable strategies for traders.
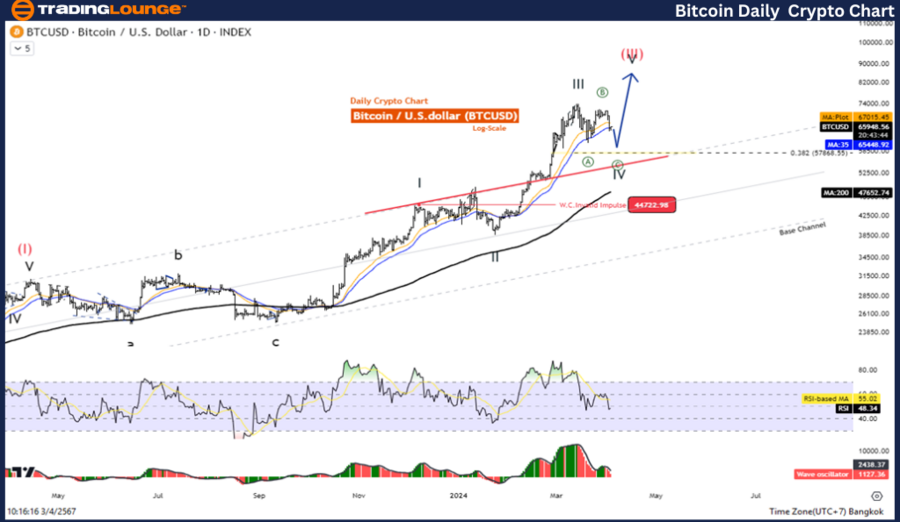
BTCUSD Daily Chart Analysis: Riding the Waves
BTCUSD Elliott Wave Technical Analysis
Function: Counter Trend
Mode: Corrective
Structure: Double Zigzag
Position: Wave ((Y))
Direction Next Higher Degrees: Wave (III)
Wave Cancel Invalid Level: 31046.25
The corrective nature of Wave IV, equivalent to 38.2% of Wave III at 57663, presents an intriguing opportunity for traders. As Bitcoin undergoes a correction phase after a prolonged upward movement in the black III wave, it tends to retreat to the 38.2% level at 57868 before embarking on the fifth wave ascent. Traders are advised to exercise patience and await the completion of the correction to re-enter the trend confidently.
Technical Indicators:
- Price above MA200, signalling an Uptrend
- Bullish Momentum indicated by the Wave Oscillator

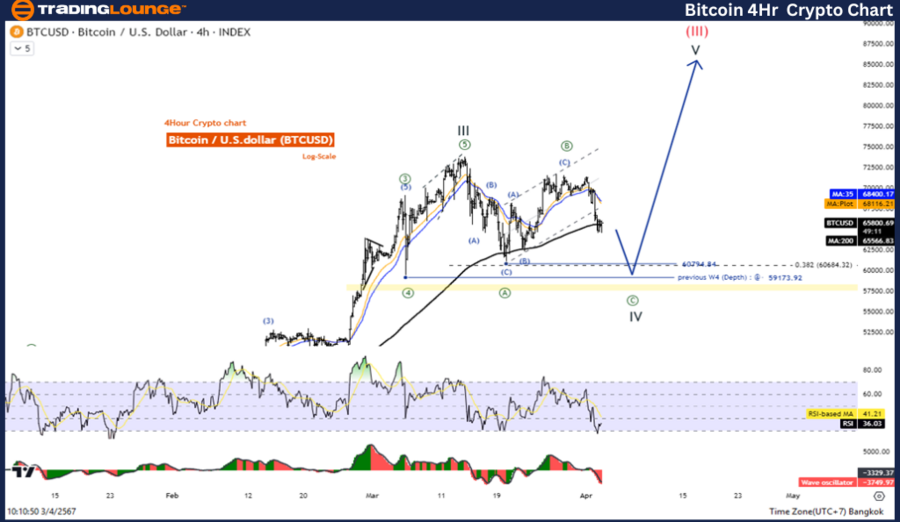
BTCUSD 4Hr Chart Analysis: Navigating Corrections with Precision
Bitcoin/ U.S. dollar(BTCUSD) Elliott Wave Analysis
Elliott Wave Technical Analysis of BTCUSD
Function: Counter Trend
Mode: Corrective
Structure: Double Zigzag
Position: Wave ((Y))
Direction Next Higher Degrees: Wave (III)
Wave Cancel Invalid Level: 31046.25
Similar to the daily chart, the 4-hour chart reinforces the corrective nature of Bitcoin's current wave pattern. Traders should remain vigilant during correction periods, as they provide opportunities for re-entry into the prevailing trend. With Wave IV often retracing to the 38.2% level at 57868 before initiating the fifth wave ascent, strategic patience is paramount.
Strategic Implications and Trading Tactics:
-
Timing the Correction: Monitor price movements closely as Bitcoin undergoes corrective phases, aiming to re-enter the market once corrections are completed.
-
Utilizing Technical Indicators: Leverage indicators such as MA200 and the Wave Oscillator to confirm trends and identify favourable entry points.
-
Risk Management: Implement effective risk management strategies to mitigate potential losses and protect capital during volatile market conditions.
Conclusion: Seizing Opportunities Amidst Market Fluctuations
In the dynamic landscape of cryptocurrency trading, Elliott Wave Analysis serves as a powerful tool for deciphering market trends and navigating price fluctuations. By understanding wave patterns and employing strategic trading tactics, traders can capitalize on opportunities presented by both corrective phases and uptrends in the BTCUSD market. Stay vigilant, exercise patience, and always prioritize risk management to thrive in the ever-evolving world of cryptocurrency trading.
Technical Analyst: Kittiampon Somboonsod
Source: visit Tradinglounge.com and learn From the Experts Join TradingLounge Here
See Previous: Theta Token/ U.S. dollar(THETAUSD)
TradingLounge Once Off SPECIAL DEAL: Here > 1 month Get 3 months.
TradingLounge's Free Week Extravaganza!
April 14 – 21: Unlock the Doors to Trading Excellence — Absolutely FREE!
