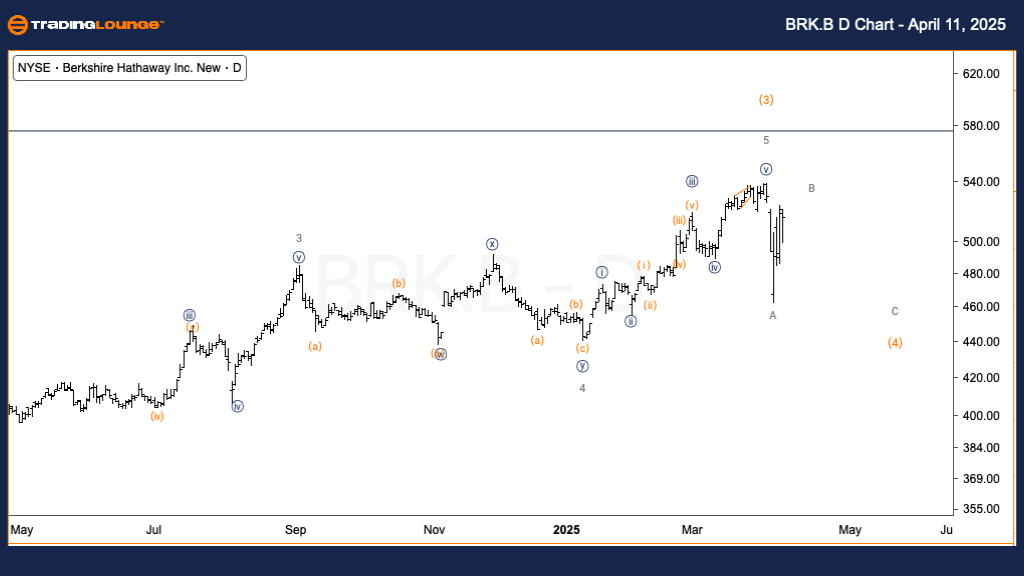
Berkshire Hathaway Inc. (BRK.B) – TradingLounge Daily Chart
Mode: Corrective
Structure: ZigZag
Position: Wave B of (4)
Details: The recent rally in wave B—following the announcement of tariff suspension—is now viewed as a corrective wave rather than an impulsive one. Analysts are monitoring the chart for potential signs of a peak forming in wave B, which may indicate the upcoming transition in the Elliott Wave cycle.
Berkshire Hathaway Inc. (BRK.B) – TradingLounge 1-Hour Chart
Mode: Corrective
Structure: ZigZag
Position: Wave {c} of B
Details: A possible triangle pattern is developing in wave {b}, which could be setting up for an upward continuation into wave {c}. This configuration is consistent with a larger corrective wave structure. Traders should look for reversal signals that would confirm the correction remains intact and signal potential entry points.
Technical Analyst: Alessio Barretta
Source: Visit Tradinglounge.com and learn from the Experts. Join TradingLounge Here
Previous: ABBV Elliott Wave Technical Analysis
VALUE Offer - Buy 1 Month & Get 3 Months!Click here
Access 7 Analysts Over 200 Markets Covered. Chat Room With Support

Berkshire Hathaway (BRK.B) Elliott Wave Analysis
This updated Elliott Wave analysis for Berkshire Hathaway Inc. (BRK.B) offers a dual time-frame outlook using both the Daily and 1-Hour charts. Current price action suggests that BRK.B is progressing through a corrective ZigZag wave pattern, with Wave B of (4) showing signs of nearing completion. The market's response to recent tariff-related developments is interpreted as corrective in nature, lacking impulsive strength.
On the 1-hour chart, a triangle formation within wave {b} appears to be emerging, setting the stage for an upward push in wave {c}. This scenario supports the broader corrective count. Investors and traders are encouraged to monitor the price action for confirmation signals, which could offer insight into the end of Wave B and the beginning of the next market movement phase.